Quantcast
Channel: Coding – The ryg blog
Viewing all 59 articles
Browse latest View live

Depth buffers done quick, part 1

$
0
0

This post is part of a series – go here for the index.

Welcome back to yet another post on my series about Intel’s Software Occlusion Culling demo. The past few posts were about triangle rasterization in general; at the end of the previous post, we saw how the techniques we’ve been discussing are actually implemented in the code. This time, we’re going to make it run faster – no further delays.

Step 0: Repeatable test setup

But before we change anything, let’s first set up repeatable testing conditions. What I’ve been doing for the previous profiles is start the program from VTune with sample collection paused, manually resume collection once loading is done, then manually exit the demo after about 20 seconds without moving the camera from the starting position.

That was good enough while we were basically just looking for unexpected hot spots that we could speed up massively with relatively little effort. For this round of changes, we expect less drastic differences between variants, so I added code that performs a repeatable testing protocol:

  1. Load the scene as before.
  2. Render 60 frames without measuring performance to allow everything to settle a bit. Graphics drivers tend to perform some initialization work (such as driver-side shader compilation) lazily, so the first few frames with any given data set tend to be spiky.
  3. Tell the profiler to start collecting samples.
  4. Render 600 frames.
  5. Tell the profile to stop collecting samples.
  6. Exit the program.

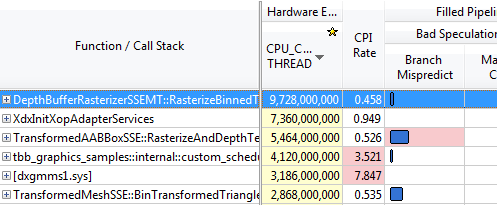
The sample already times how much time is spent in rendering the depth buffer and in the occlusion culling (which is another rasterizer that Z-tests a bounding box against the depth buffer prepared in the first step). I also log these measurements and print out some summary statistics at the end of the run. For both the rendering time and the occlusion test time, I print out the minimum, 25th percentile, median, 75th percentile and maximum of all observed values, together with the mean and standard deviation. This should give us a good idea of how these values are distributed. Here’s a first run:


Render time:
  min=3.400ms  25th=3.442ms  med=3.459ms  75th=3.473ms  max=3.545ms
  mean=3.459ms sdev=0.024ms
Test time:
  min=1.653ms  25th=1.875ms  med=1.964ms  75th=2.036ms  max=2.220ms
  mean=1.957ms sdev=0.108ms

and here’s a second run on the same code (and needless to say, the same machine) to test how repeatable these results are:

Render time:
  min=3.367ms  25th=3.420ms  med=3.432ms  75th=3.445ms  max=3.512ms
  mean=3.433ms sdev=0.021ms
Test time:
  min=1.586ms  25th=1.870ms  med=1.958ms  75th=2.025ms  max=2.211ms
  mean=1.941ms sdev=0.119ms

As you can see, the two runs are within about 1% of each other for all the measurements – good enough for our purposes, at least right now. Also, the distribution appears to be reasonably smooth, with the caveat that the depth testing times tend to be fairly noisy. I’ll give you the updated timings after every significant change so we can see how the speed evolves over time. And by the way, just to make that clear, this business of taking a few hundred samples and eyeballing the order statistics is most definitely not a statistically sound methodology. It happens to work out in our case because we have a nice repeatable test and will only be interested in fairly strong effects. But you need to be careful about how you measure and compare performance results in more general settings. That’s a topic for another time, though.

Now, to make it a bit more readable as I add more observations, I’ll present the results in a table as follows: (this is the render time)

Version min 25th med 75th max mean sdev
Initial 3.367 3.420 3.432 3.445 3.512 3.433 0.021

I won’t bother with the test time here (even though the initial version of this post did) because the code doesn’t get changed; it’s all noise.

Step 1: Get rid of special cases

Now, if you followed the links to the code I posted last time, you might’ve noticed that the code checks the variable gVisualizeDepthBuffer multiple times, even in the inner loop. An example is this passage that loads the current depth buffer values at the target location:

__m128 previousDepthValue;
if(gVisualizeDepthBuffer)
{
    previousDepthValue = _mm_set_ps(pDepthBuffer[idx],
        pDepthBuffer[idx + 1],
        pDepthBuffer[idx + SCREENW],
        pDepthBuffer[idx + SCREENW + 1]);
}
else
{
    previousDepthValue = *(__m128*)&pDepthBuffer[idx];
}

I briefly mentioned this last time: this rasterizer processes blocks of 2×2 pixels at a time. If depth buffer visualization is on, the depth buffer is stored in the usual row-major layout normally used for 2D arrays in C/C++: In memory, we first have all pixels for the (topmost) row 0 (left to right), then all pixels for row 1, and so forth for the whole size of the image. If you draw a diagram of how the pixels are laid out in memory, it looks like this:

8x8 pixels in raster-scan order

8×8 pixels in raster-scan order

This is also the format that graphics APIs typically expect you to pass textures in. But if you’re writing pixels blocks of 2×2 at a time, that means you always need to split your reads (and writes) into two accesses to the two affected rows – annoying. By contrast, if depth buffer visualization is off, the code uses a tiled layout that looks more like this:

8x8 pixels in a 2x2 tiled layout

8×8 pixels in a 2×2 tiled layout

This layout doesn’t break up the 2×2 groups of pixels; in effect, instead of a 2D array of pixels, we now have a 2D array of 2×2 pixel blocks. This is a so-called “tiled” layout; I’ve written about this before if you’re not familiar with the concept. Tiled layouts makes access much easier and faster provided that our 2×2 blocks are always at properly aligned positions – we would still need to access multiple locations if we wanted to read our 2×2 pixels from, say, an odd instead of an even row. The rasterizer code always keeps the 2×2 blocks aligned to even x and y coordinates to make sure depth buffer accesses can be done quickly.

The tiled layout provides better performance, so it’s the one we want to use in general. So instead of switching to linear layout when the user wants to see the depth buffer, I changed the code to always store the depth buffer tiled, and then perform the depth buffer visualization using a custom pixel shader that knows how to read the pixels in tiled format. It took me a bit of time to figure out how to do this within the app framework, but it really wasn’t hard. Once that’s done, there’s no need to keep the linear storage code around, and a bunch of special cases just disappear. Caveat: The updated code assumes that the depth buffer is always stored in tiled format; this is true for the SSE versions of the rasterizers, but not the scalar versions that the demo also showcases. It shouldn’t be hard to use a different shader when running the scalar variants, but I didn’t bother maintaining them in my branches because they’re only there for illustration anyway.

So, we always use the tiled layout (but we did that throughout the test run before too, since I don’t enable depth buffer visualization in it!) and we get rid of the alternative paths completely. Does it help?

Change: Remove support for linear depth buffer layout.

Version min 25th med 75th max mean sdev
Initial 3.367 3.420 3.432 3.445 3.512 3.433 0.021
Always tiled depth 3.357 3.416 3.428 3.443 3.486 3.429 0.021

We get a lower value for the depth tests, but that doesn’t necessarily mean much, because it’s still within a little more than a standard deviation of the previous measurements. And the difference in depth test performance is easily within a standard deviation too. So there’s no appreciable difference from this change by itself; turns out that modern x86s are pretty good at dealing with branches that always go the same way. It did simplify the code, though, which will make further optimizations easier. Progress.

Step 2: Try to do a little less work

Let me show you the whole inner loop (with some cosmetic changes so it fits in the layout, damn those overlong Intel SSE intrinsics) so you can see what I’m talking about:

for(int c = startXx; c < endXx;
        c += 2,
        idx += 4,
        alpha = _mm_add_epi32(alpha, aa0Inc),
        beta  = _mm_add_epi32(beta, aa1Inc),
        gama  = _mm_add_epi32(gama, aa2Inc))
{
    // Test Pixel inside triangle
    __m128i mask = _mm_cmplt_epi32(fxptZero, 
        _mm_or_si128(_mm_or_si128(alpha, beta), gama));
					
    // Early out if all of this quad's pixels are
    // outside the triangle.
    if(_mm_test_all_zeros(mask, mask))
        continue;
					
    // Compute barycentric-interpolated depth
    __m128 betaf = _mm_cvtepi32_ps(beta);
    __m128 gamaf = _mm_cvtepi32_ps(gama);
    __m128 depth = _mm_mul_ps(_mm_cvtepi32_ps(alpha), zz[0]);
    depth = _mm_add_ps(depth, _mm_mul_ps(betaf, zz[1]));
    depth = _mm_add_ps(depth, _mm_mul_ps(gamaf, zz[2]));

    __m128 previousDepthValue = *(__m128*)&pDepthBuffer[idx];

    __m128 depthMask = _mm_cmpge_ps(depth, previousDepthValue);
    __m128i finalMask = _mm_and_si128(mask,
        _mm_castps_si128(depthMask));

    depth = _mm_blendv_ps(previousDepthValue, depth,
        _mm_castsi128_ps(finalMask));
    _mm_store_ps(&pDepthBuffer[idx], depth);
}

As I said last time, we expect at least 50% of the pixels inside an average triangle’s bounding box to be outside the triangle. This loop neatly splits into two halves: The first half is until the early-out tests, and simply steps the edge equations and tests whether any pixels within the current 2×2 pixel block (quad) are inside the triangle. The second half then performs barycentric interpolation and the depth buffer update.

Let’s start with the top half. At first glance, there doesn’t appear to be much we can do about the amount of work we do, at least with regards to the SSE operations: we need to step the edge equations (inside the for statement). The code already does the OR trick to only do one comparison. And we use a single test (which compiles into the PTEST instruction) to check whether we can skip the quad. Not much we can do here, or is there?

Well, turns out there’s one thing: we can get rid of the compare. Remember that for two’s complement integers, compares of the type x < 0 or x >= 0 can be performed by just looking at the sign bit. Unfortunately, the test here is of the form x > 0, which isn’t as easy – couldn’t it be >= 0 instead?

Turns out: it could. Because our x is only ever 0 when all three edge functions are 0 – that is, the current pixel lies right on all three edges at the same time. And the only way that can ever happen is for the triangle to be degenerate (zero-area). But we never rasterize zero-area triangles – they get culled before we ever reach this loop! So the case x == 0 can never actually happen, which means it makes no difference whether we write x >= 0 or x > 0. And the condition x >= 0, we can implement by simply checking whether the sign bit is zero. Whew! Okay, so we get:

__m128i mask = _mm_or_si128(_mm_or_si128(alpha, beta), gama));

Now, how do we test the sign bit without using an extra instruction? Well, it turns out that the instruction we use to determine whether we should early-out is PTEST, which already performs a binary AND. And it also turns out that the check we need (“are the sign bits set for all four lanes?”) can be implemented using the very same instruction:

if(_mm_testc_si128(_mm_set1_epi32(0x80000000), mask))

Note that the semantics of mask have changed, though: before, each SIMD lane held either the value 0 (“point outside triangle”) or -1 (“point inside triangle). Now, it either holds a nonnegative value (sign bit 0, “point inside triangle”) or a negative one (sign bit 1, “point outside triangle”). The instructions that end up using this value only care about the sign bit, but still, we ended up exactly flipping which one indicates “inside” and which one means “outside”. Lucky for us, that’s easily remedied in the computation of finalMask, still only by changing ops without adding any:

__m128i finalMask = _mm_andnot_si128(mask,
    _mm_castps_si128(depthMask));

We simply use andnot instead of and. Okay, I admit that was a bit of trouble to get rid of a single instruction, but this is a tight inner loop that’s not being slowed down by memory effects or other micro-architectural issues. In short, this is one of the (nowadays rare) places where that kind of stuff actually matters. So, did it help?

Change: Get rid of compare.

Version min 25th med 75th max mean sdev
Initial 3.367 3.420 3.432 3.445 3.512 3.433 0.021
Always tiled depth 3.357 3.416 3.428 3.443 3.486 3.429 0.021
One compare less 3.250 3.296 3.307 3.324 3.434 3.313 0.025

Yes indeed: render time is down by 0.1ms – about 4 standard deviations, a significant win (and yes, this is repeatable). To be fair, as we’ve already seen in previous post: this is unlikely to be solely attributable to removing a single instruction. Even if we remove (or change) just one intrinsic in the source code, this can have ripple effects on register allocation and scheduling that together make a larger difference. And just as importantly, sometimes changing the code in any way at all will cause the compiler to accidentally generate a code placement that performs better at run time. So it would be foolish to take all the credit – but still, it sure is nice when this kind of thing happens.

Step 2b: Squeeze it some more

Next, we look at the second half of the loop, after the early-out. This half is easier to find worthwhile targets in. Currently, we perform full barycentric interpolation to get the per-pixel depth value:

z = \alpha z_0 + \beta z_1 + \gamma z_2

Now, as I mentioned at the end of “The barycentric conspiracy”, we can use the alternative form

z = z_0 + \beta (z_1 - z_0) + \gamma (z_2 - z_0)

when the barycentric coordinates are normalized, or more generally

\displaystyle z = z_0 + \beta \left(\frac{z_1 - z_0}{\alpha + \beta + \gamma}\right) + \gamma \left(\frac{z_2 - z_0}{\alpha + \beta + \gamma}\right)

when they’re not. And since the terms in parentheses are constants, we can compute them once, and get rid of a int-to-float conversion and a multiply in the inner loop – two less instructions for a bit of extra setup work once per triangle. Namely, our per-triangle setup computation goes from

__m128 oneOverArea = _mm_set1_ps(oneOverTriArea.m128_f32[lane]);
zz[0] *= oneOverArea;
zz[1] *= oneOverArea;
zz[2] *= oneOverArea;

to

__m128 oneOverArea = _mm_set1_ps(oneOverTriArea.m128_f32[lane]);
zz[1] = (zz[1] - zz[0]) * oneOverArea;
zz[2] = (zz[2] - zz[0]) * oneOverArea;

and our per-pixel interpolation goes from

__m128 depth = _mm_mul_ps(_mm_cvtepi32_ps(alpha), zz[0]);
depth = _mm_add_ps(depth, _mm_mul_ps(betaf, zz[1]));
depth = _mm_add_ps(depth, _mm_mul_ps(gamaf, zz[2]));

to

__m128 depth = zz[0];
depth = _mm_add_ps(depth, _mm_mul_ps(betaf, zz[1]));
depth = _mm_add_ps(depth, _mm_mul_ps(gamaf, zz[2]));

And what do our timings say?

Change: Alternative interpolation formula

Version min 25th med 75th max mean sdev
Initial 3.367 3.420 3.432 3.445 3.512 3.433 0.021
Always tiled depth 3.357 3.416 3.428 3.443 3.486 3.429 0.021
One compare less 3.250 3.296 3.307 3.324 3.434 3.313 0.025
Simplify interp. 3.195 3.251 3.265 3.276 3.332 3.264 0.024

Render time is down by about another 0.05ms, and the whole distribution has shifted down by roughly that amount (without increasing variance), so this seems likely to be an actual win.

Finally, there’s another place where we can make a difference by better instruction selection. Our current depth buffer update code looks as follows:

    __m128 previousDepthValue = *(__m128*)&pDepthBuffer[idx];

    __m128 depthMask = _mm_cmpge_ps(depth, previousDepthValue);
    __m128i finalMask = _mm_andnot_si128(mask,
        _mm_castps_si128(depthMask));

    depth = _mm_blendv_ps(previousDepthValue, depth,
        _mm_castsi128_ps(finalMask));

finalMask here is a mask that encodes “pixel lies inside the triangle AND has a larger depth value than the previous pixel at that location”. The blend instruction then selects the new interpolated depth value for the lanes where finalMask has the sign bit (MSB) set, and the previous depth value elsewhere. But we can do slightly better, because SSE provides MAXPS, which directly computes the maximum of two floating-point numbers. Using max, we can rewrite this expression to read:

    __m128 previousDepthValue = *(__m128*)&pDepthBuffer[idx];
    __m128 mergedDepth = _mm_max_ps(depth, previousDepthValue);
    depth = _mm_blendv_ps(mergedDepth, previousDepthValue,
        _mm_castsi128_ps(mask));

This is a slightly different way to phrase the solution – “pick whichever is largest of the previous and the interpolated depth value, and use that as new depth if this pixel is inside the triangle, or stick with the old depth otherwise” – but it’s equivalent, and we lose yet another instruction. And just as important on the notoriously register-starved 32-bit x86, it also needs one less temporary register.

Let’s check whether it helps!

Change: Alternative depth update formula

Version min 25th med 75th max mean sdev
Initial 3.367 3.420 3.432 3.445 3.512 3.433 0.021
Always tiled depth 3.357 3.416 3.428 3.443 3.486 3.429 0.021
One compare less 3.250 3.296 3.307 3.324 3.434 3.313 0.025
Simplify interp. 3.195 3.251 3.265 3.276 3.332 3.264 0.024
Revise depth update 3.152 3.182 3.196 3.208 3.316 3.198 0.025

It does appear to shave off another 0.05ms, bringing the total savings due to our instruction-shaving up to about 0.2ms – about a 6% reduction in running time so far. Considering that we started out with code that was already SIMDified and fairly optimized to start with, that’s not a bad haul at all. But we seem to have exhausted the obvious targets. Does that mean that this is as fast as it’s going to go?

Step 3: Show the outer loops some love

Of course not. This is actually a common mistake people make during optimization sessions: focusing on the innermost loops to the exclusion of everything else. Just because a loop is at the innermost nesting level doesn’t necessarily mean it’s more important than everything else. A profiler can help you figure out how often code actually runs, but in our case, I’ve already mentioned several times that we’re dealing with lots of small triangles. This means that we may well run through our innermost loop only once or twice per row of 2×2 blocks! And for a lot of triangles, we’ll only do one or two of such rows too. Which means we should definitely also pay attention to the work we do per block row and per triangle.

So let’s look at our row loop:

for(int r = startYy; r < endYy;
        r += 2,
        row  = _mm_add_epi32(row, _mm_set1_epi32(2)),
        rowIdx = rowIdx + 2 * SCREENW,
        bb0Row = _mm_add_epi32(bb0Row, bb0Inc),
        bb1Row = _mm_add_epi32(bb1Row, bb1Inc),
        bb2Row = _mm_add_epi32(bb2Row, bb2Inc))
{
    // Compute barycentric coordinates 
    int idx = rowIdx;
    __m128i alpha = _mm_add_epi32(aa0Col, bb0Row);
    __m128i beta = _mm_add_epi32(aa1Col, bb1Row);
    __m128i gama = _mm_add_epi32(aa2Col, bb2Row);

    // <Column loop here>
}

Okay, we don’t even need to get fancy here – there’s two things that immediately come to mind. First, we seem to be updating row even though nobody in this loop (or the inner loop) uses it. That’s not a performance problem – standard dataflow analysis techniques in compilers are smart enough to figure this kind of stuff out and just eliminate the computation – but it’s still unnecessary code that we can just remove, so we should. Second, we add the initial column terms of the edge equations (aa0Col, aa1Col, aa2Col) to the row terms (bb0Row etc.) every line. There’s no need to do that – the initial column terms don’t change during the row loop, so we can just do these additions once per triangle!

So before the loop, we add:

    __m128i sum0Row = _mm_add_epi32(aa0Col, bb0Row);
    __m128i sum1Row = _mm_add_epi32(aa1Col, bb1Row);
    __m128i sum2Row = _mm_add_epi32(aa2Col, bb2Row);

and then we change the row loop itself to read:

for(int r = startYy; r < endYy;
        r += 2,
        rowIdx = rowIdx + 2 * SCREENW,
        sum0Row = _mm_add_epi32(sum0Row, bb0Inc),
        sum1Row = _mm_add_epi32(sum1Row, bb1Inc),
        sum2Row = _mm_add_epi32(sum2Row, bb2Inc))
{
    // Compute barycentric coordinates 
    int idx = rowIdx;
    __m128i alpha = sum0Row;
    __m128i beta = sum1Row;
    __m128i gama = sum2Row;

    // <Column loop here>
}

That’s probably the most straightforward of all the changes we’ve seen so far. But still, it’s in an outer loop, so we wouldn’t expect to get as much out of this as if we had saved the equivalent amount of work in the inner loop. Any guesses for how much it actually helps?

Change: Straightforward tweaks to the outer loop

Version min 25th med 75th max mean sdev
Initial 3.367 3.420 3.432 3.445 3.512 3.433 0.021
Always tiled depth 3.357 3.416 3.428 3.443 3.486 3.429 0.021
One compare less 3.250 3.296 3.307 3.324 3.434 3.313 0.025
Simplify interp. 3.195 3.251 3.265 3.276 3.332 3.264 0.024
Revise depth update 3.152 3.182 3.196 3.208 3.316 3.198 0.025
Tweak row loop 3.020 3.081 3.095 3.106 3.149 3.093 0.020

I bet you didn’t expect that one. I think I’ve made my point.

UPDATE: An earlier version had what turned out to be an outlier measurement here (mean of exactly 3ms). Every 10 runs or so, I get a run that is a bit faster than usual; I haven’t found out why yet, but I’ve updated the list above to show a more typical measurement. It’s still a solid win, just not as big as initially posted.

And with the mean run time of our depth buffer rasterizer down by about 10% from the start, I think this should be enough for one post. As usual, I’ve updated the head of the blog branch on Github to include today’s changes, if you’re interested. Next time, we’ll look a bit more at the outer loops and whip out VTune again for a surprise discovery! (Well, surprising for you anyway.)

By the way, this is one of these code-heavy play-by-play posts. With my regular articles, I’m fairly confident that the format works as a vehicle for communicating ideas, but this here is more like an elaborate case study. I know that I have fun writing in this format, but I’m not so sure if it actually succeeds at delivering valuable information, or if it just turns into a parade of super-specialized tricks that don’t seem to generalize in any useful way. I’d appreciate some input before I start knocking out more posts like this :). Anyway, thanks for reading, and until next time!


Depth buffers done quick, part 2

$
0
0

This post is part of a series – go here for the index.

Welcome back! At the end of the last post, we had just finished doing a first pass over the depth buffer rendering loops. Unfortunately, the first version of that post listed a final rendering time that was an outlier; more details in the post (which also has been updated to display the timing results in tables).

Notation matters

However, while writing that post, it became clear to me that I needed to do something about those damn over-long Intel SSE intrinsic names. Having them in regular source code is one thing, but it really sucks for presentation when performing two bitwise operations barely fits inside a single line of source code. So I whipped up two helper classes VecS32 (32-bit signed integer) and VecF32 (32-bit float) that are actual C++ implementations of the pseudo-code Vec4i I used in “Optimizing the basic rasterizer”. I then converted a lot of the SIMD code in the project to use those classes instead of dealing with __m128 and __m128i directly.

I’ve used this kind of approach in the past to provide a useful common subset of SIMD operations for cross-platform code; in this case, the main point was to get some basic operator overloads and more convenient notation, but as a happy side effect it’s now much easier to make the code use SSE2 instructions only. The original code uses SSE4.1, but with the everything nicely in one place, it’s easy to use MOVMSKPS / CMP instead of PTEST for the mask tests and PSRAD / ANDPS / ANDNOTPS / ORPS instead of BLENDVPS; you just have to do the substitution in one place. I haven’t done that in the code on Github, but I wanted to point out that it’s an option.

Anyway, I won’t go over the details of either the helper classes (it’s fairly basic stuff) or the modifications to the code (just glorified search and replace), but I will show you one before-after example to illustrate why I did it:

col = _mm_add_epi32(colOffset, _mm_set1_epi32(startXx));
__m128i aa0Col = _mm_mullo_epi32(aa0, col);
__m128i aa1Col = _mm_mullo_epi32(aa1, col);
__m128i aa2Col = _mm_mullo_epi32(aa2, col);

row = _mm_add_epi32(rowOffset, _mm_set1_epi32(startYy));
__m128i bb0Row = _mm_add_epi32(_mm_mullo_epi32(bb0, row), cc0);
__m128i bb1Row = _mm_add_epi32(_mm_mullo_epi32(bb1, row), cc1);
__m128i bb2Row = _mm_add_epi32(_mm_mullo_epi32(bb2, row), cc2);

__m128i sum0Row = _mm_add_epi32(aa0Col, bb0Row);
__m128i sum1Row = _mm_add_epi32(aa1Col, bb1Row);
__m128i sum2Row = _mm_add_epi32(aa2Col, bb2Row);

turns into:

VecS32 col = colOffset + VecS32(startXx);
VecS32 aa0Col = aa0 * col;
VecS32 aa1Col = aa1 * col;
VecS32 aa2Col = aa2 * col;

VecS32 row = rowOffset + VecS32(startYy);
VecS32 bb0Row = bb0 * row + cc0;
VecS32 bb1Row = bb1 * row + cc1;
VecS32 bb2Row = bb2 * row + cc2;

VecS32 sum0Row = aa0Col + bb0Row;
VecS32 sum1Row = aa1Col + bb1Row;
VecS32 sum2Row = aa2Col + bb2Row;

I don’t know about you, but I already find this much easier to parse visually, and the generated code is the same. And as soon as I had this, I just got rid of most of the explicit temporaries since they’re never referenced again anyway:

VecS32 col = VecS32(startXx) + colOffset;
VecS32 row = VecS32(startYy) + rowOffset;

VecS32 sum0Row = aa0 * col + bb0 * row + cc0;
VecS32 sum1Row = aa1 * col + bb1 * row + cc1;
VecS32 sum2Row = aa2 * col + bb2 * row + cc2;

And suddenly, with the ratio of syntactic noise to actual content back to a reasonable range, it’s actually possible to see what’s really going on here in one glance. Even if this was slower – and as I just told you, it’s not – it would still be totally worthwhile for development. You can’t always do it this easily; in particular, with integer SIMD instructions (particularly when dealing with pixels), I often find myself frequently switching between the interpretation of values (“typecasting”), and adding explicit types adds more syntactic noise than it eliminates. But in this case, we actually have several relatively long functions that only deal with either 32-bit ints or 32-bit floats, so it works beautifully.

And just to prove that it really didn’t change the performance:

Change: VecS32/VecF32

Version min 25th med 75th max mean sdev
Initial 3.367 3.420 3.432 3.445 3.512 3.433 0.021
End of part 1 3.020 3.081 3.095 3.106 3.149 3.093 0.020
Vec[SF]32 3.022 3.056 3.067 3.081 3.153 3.069 0.018

A bit more work on setup

With that out of the way, let’s spiral further outwards and have a look at our triangle setup code. Most of it sets up edge equations etc. for 4 triangles at a time; we only drop down to individual triangles once we’re about to actually rasterize them. Most of this code works exactly as we saw in “Optimizing the basic rasterizer”, but there’s one bit that performs a bit more work than necessary:

// Compute triangle area
VecS32 triArea = A0 * xFormedFxPtPos[0].X;
triArea += B0 * xFormedFxPtPos[0].Y;
triArea += C0;

VecF32 oneOverTriArea = VecF32(1.0f) / itof(triArea);

Contrary to what the comment says :), this actually computes twice the (signed) triangle area and is used to normalize the barycentric coordinates. That’s also why there’s a divide to compute its reciprocal. However, the computation of the area itself is more complicated than necessary and depends on C0. A better way is to just use the direct determinant expression. Since the area is computed in integers, this gives exactly the same results with one operations less, and without the dependency on C0:

VecS32 triArea = B2 * A1 - B1 * A2;
VecF32 oneOverTriArea = VecF32(1.0f) / itof(triArea);

And talking about the barycentric coordinates, there’s also this part of the setup that is performed per triangle, not across 4 triangles:

VecF32 zz[3], oneOverW[3];
for(int vv = 0; vv < 3; vv++)
{
    zz[vv] = VecF32(xformedvPos[vv].Z.lane[lane]);
    oneOverW[vv] = VecF32(xformedvPos[vv].W.lane[lane]);
}

VecF32 oneOverTotalArea(oneOverTriArea.lane[lane]);
zz[1] = (zz[1] - zz[0]) * oneOverTotalArea;
zz[2] = (zz[2] - zz[0]) * oneOverTotalArea;

The latter two lines perform the half-barycentric interpolation setup; the original code multiplied the zz[i] by oneOverTotalArea here (this is the normalization for the barycentric terms). But note that all the quantities involved here are vectors of four broadcast values; these are really scalar computations, and we can perform them while we’re still dealing with 4 triangles at a time! So right after the triangle area computation, we now do this:

// Z setup
VecF32 Z[3];
Z[0] = xformedvPos[0].Z;
Z[1] = (xformedvPos[1].Z - Z[0]) * oneOverTriArea;
Z[2] = (xformedvPos[2].Z - Z[0]) * oneOverTriArea;

Which allows us to get rid of the second half of the earlier block – all we have to do is load zz from Z[vv] rather than xformedvPos[vv].Z. Finally, the original code sets up oneOverW but never uses it, and it turns out that in this case, VC++’s data flow analysis was not smart enough to figure out that the computation is unnecessary. No matter – just delete that code as well.

So this batch is just a bunch of small, simple, local improvements: getting rid of a little unnecessary work in several places, or just grouping computations more effectively. It’s small fry, but it’s also very low-effort, so why not.

Change: Various minor setup improvements

Version min 25th med 75th max mean sdev
Initial 3.367 3.420 3.432 3.445 3.512 3.433 0.021
End of part 1 3.020 3.081 3.095 3.106 3.149 3.093 0.020
Vec[SF]32 3.022 3.056 3.067 3.081 3.153 3.069 0.018
Setup cleanups 2.977 3.032 3.046 3.058 3.101 3.045 0.020

As said, it’s minor, but a small win nonetheless.

Garbage in the bins

When I was originally performing the experiments that led to this series, I discovered something funny when I had the code at roughly this stage: occasionally, I would get triangles that had endXx < startXx (or endYy < startYy). I only noticed this because I changed the loop in a way that should have been equivalent, but turned out not to be: I was computing endXx - startXx as an unsigned integer, and it wrapped around, causing the code to start stomping over memory and eventually crash. At the time, I just made note to investigate this later and just added an if to detect the case early for the time being, but when I later came back to figure out what was going on, the explanation turned out to be quite interesting.

So, where do these triangles with empty bounding boxes come from? The actual per-triangle assignments

int startXx = startX.lane[lane];
int endXx   = endX.lane[lane];

just get their values from these vectors:

// Use bounding box traversal strategy to determine which
// pixels to rasterize 
VecS32 startX = vmax(
    vmin(
        vmin(xFormedFxPtPos[0].X, xFormedFxPtPos[1].X),
        xFormedFxPtPos[2].X), VecS32(tileStartX))
    & VecS32(~1);
VecS32 endX = vmin(
    vmax(
        vmax(xFormedFxPtPos[0].X, xFormedFxPtPos[1].X),
        xFormedFxPtPos[2].X) + VecS32(1), VecS32(tileEndX));

Horrible line-breaking aside (I just need to switch to a wider layout), this is fairly straightforward: startX is determined as the minimum of all vertex X coordinates, then clipped against the left tile boundary and finally rounded down to be a multiple of 2 (to align with the 2×2 tiling grid). Similarly, endX is the maximum of vertex X coordinates, clipped against the right boundary of the tile. Since we use an inclusive fill convention but exclusive loop bounds on the right side (the test is for < endXx not <= endXx), there’s an extra +1 in there.

Other than the clip to the tile bounds, this really just computes an axis-aligned bounding rectangle for the triangle and then potentially makes it a little bigger. So really, the only way to get endXx < startXx from this is for the triangle to have an empty intersection with the active tile’s bounding box. But if that’s the case, why was the triangle added to the bin for this tile to begin with? Time to look at the binner code.

The relevant piece of code is here. The bounding box determination for the whole triangle looks as follows:

VecS32 vStartX = vmax(
    vmin(
        vmin(xFormedFxPtPos[0].X, xFormedFxPtPos[1].X), 
        xFormedFxPtPos[2].X), VecS32(0));
VecS32 vEndX   = vmin(
    vmax(
        vmax(xFormedFxPtPos[0].X, xFormedFxPtPos[1].X),
        xFormedFxPtPos[2].X) + VecS32(1), VecS32(SCREENW));

Okay, that’s basically the same we saw before, only we’re clipping against the screen bounds not the tile bounds. And the same happens with Y. Nothing to see here so far, move along. But then, what does the code do with these bounds? Let’s have a look:

// Convert bounding box in terms of pixels to bounding box
// in terms of tiles
int startX = max(vStartX.lane[i]/TILE_WIDTH_IN_PIXELS, 0);
int endX   = min(vEndX.lane[i]/TILE_WIDTH_IN_PIXELS,
                 SCREENW_IN_TILES-1);

int startY = max(vStartY.lane[i]/TILE_HEIGHT_IN_PIXELS, 0);
int endY   = min(vEndY.lane[i]/TILE_HEIGHT_IN_PIXELS,
                 SCREENH_IN_TILES-1);

// Add triangle to the tiles or bins that the bounding box covers
int row, col;
for(row = startY; row <= endY; row++)
{
    int offset1 = YOFFSET1_MT * row;
    int offset2 = YOFFSET2_MT * row;
    for(col = startX; col <= endX; col++)
    {
        // ...
    }
}

And in this loop, the triangles get added to the corresponding bins. So the bug must be somewhere in here. Can you figure out what’s going on?

Okay, I’ll spill. The problem is triangles that are completely outside the top or left screen edges, but not too far outside, and it’s caused by the division at the top. Being regular C division, it’s truncating – that is, it always rounds towards zero (Note: In C99/C++11, it’s actually defined that way; C89 and C++98 leave it up to the compiler, but on x86 all compilers I’m aware of use truncation, since that’s what the hardware does). Say that our tiles measure 100×100 pixels (they don’t, but that doesn’t matter here). What happens if we get a triangle whose bounding box goes from, say, minX=-75 to maxX=-38? First, we compute vStartX to be 0 in that lane (vStartX is clipped against the left edge) and vEndX as -37 (it gets incremented by 1, but not clipped). This looks weird, but is completely fine – that’s an empty rectangle. However, in the computation of startX and endX, we divide both these values by 100, and get zero both times. And since the tile start and end coordinates are inclusive not exclusive (look at the loop conditions!), this is not fine – the leftmost column of tiles goes from x=0 to x=99 (inclusive), and our triangle doesn’t overlap that! Which is why we then get an empty bounding box in the actual rasterizer.

There’s two ways to fix this problem. The first is to use “floor division”, i.e. division that always rounds down, no matter the sign. This will again generate an empty rectangle in this case, and everything works fine. However, C/C++ don’t have a floor division operator, so this is somewhat awkward to express in code, and I went for the simpler option: just check whether the bounding rectangle is empty before we even do the divide.

if(vEndX.lane[i] < vStartX.lane[i] ||
   vEndY.lane[i] < vStartY.lane[i]) continue;

And there’s another problem with the code as-is: There’s an off-by-one error. Suppose we have a triangle with maxX=99. Then we’ll compute vEndX as 100 and end up inserting the triangle into the bin for x=100 to x=199, which again it doesn’t overlap. The solution is simple: stop adding 1 to vEndX and clamp it to SCREENW - 1 instead of SCREENW! And with these two issues fixed, we now have a binner that really only bins triangles into tiles intersected by their bounding boxes. Which, in a nice turn of events, also means that our depth rasterizer sees slightly fewer triangles! Does it help?

Change: Fix a few binning bugs

Version min 25th med 75th max mean sdev
Initial 3.367 3.420 3.432 3.445 3.512 3.433 0.021
End of part 1 3.020 3.081 3.095 3.106 3.149 3.093 0.020
Vec[SF]32 3.022 3.056 3.067 3.081 3.153 3.069 0.018
Setup cleanups 2.977 3.032 3.046 3.058 3.101 3.045 0.020
Binning fixes 2.972 3.008 3.022 3.035 3.079 3.022 0.020

Not a big improvement, but then again, this wasn’t even for performance, it was just a regular bug fix! Always nice when they pay off this way.

One more setup tweak

With that out of the way, there’s one bit of unnecessary work left in our triangle setup: If you look at the current triangle setup code, you’ll notice that we convert all four of X, Y, Z and W to integer (fixed-point), but we only actually look at the integer versions for X and Y. So we can stop converting Z and W. I also renamed the variables to have shorter names, simply to make the code more readable. So this change ends up affecting lots of lines, but the details are trivial, so I’m just going to give you the results:

Change: Don’t convert Z/W to fixed point

Version min 25th med 75th max mean sdev
Initial 3.367 3.420 3.432 3.445 3.512 3.433 0.021
End of part 1 3.020 3.081 3.095 3.106 3.149 3.093 0.020
Vec[SF]32 3.022 3.056 3.067 3.081 3.153 3.069 0.018
Setup cleanups 2.977 3.032 3.046 3.058 3.101 3.045 0.020
Binning fixes 2.972 3.008 3.022 3.035 3.079 3.022 0.020
No fixed-pt. Z/W 2.958 2.985 2.991 2.999 3.048 2.992 0.012

And with that, we are – finally! – down about 0.1ms from where we ended the previous post.

Time to profile

Evidently, progress is slowing down. This is entirely expected; we’re running out of easy targets. But while we’ve been starting intensely at code, we haven’t really done any more in-depth profiling than just looking at overall timings in quite a while. Time to bring out VTune again and check if the situation’s changed since our last detailed profiling run, way back at the start of “Frustum culling: turning the crank”.

Here’s the results:

Rasterization hot spots

Unlike our previous profiling runs, there’s really no smoking guns here. At a CPI rate of 0.459 (so we’re averaging about 2.18 instructions executed per cycle over the whole function!) we’re doing pretty well: in “Frustum culling: turning the crank”, we were still at 0.588 clocks per instruction. There’s a lot of L1 and L2 cache line replacements (i.e. cache lines getting cycled in and out), but that is to be expected – at 320×90 pixels times one float each, our tiles come out at about 112kb, which is larger than our L1 data cache and takes up a significant amount of the L2 cache for each core. But for all that, we don’t seem to be terribly bottlenecked by it; if we were seriously harmed by cache effects, we wouldn’t be running nearly as fast as we do.

Pretty much the only thing we do see is that we seem to be getting a lot of branch mispredictions. Now, if you were to drill into them, you would notice that most of these related to the row/column loops, so they’re purely a function of the triangle size. However, we do still perform the early-out check for each quad. With the initial version of the code, that’s a slight win (I checked, even though I didn’t bother telling you about it), but that a version of the code that had more code in the inner loop, and of course the test itself has some execution cost too. Is it still worthwhile? Let’s try removing it.

Change: Remove “quad not covered” early-out

Version min 25th med 75th max mean sdev
Initial 3.367 3.420 3.432 3.445 3.512 3.433 0.021
End of part 1 3.020 3.081 3.095 3.106 3.149 3.093 0.020
Vec[SF]32 3.022 3.056 3.067 3.081 3.153 3.069 0.018
Setup cleanups 2.977 3.032 3.046 3.058 3.101 3.045 0.020
Binning fixes 2.972 3.008 3.022 3.035 3.079 3.022 0.020
No fixed-pt. Z/W 2.958 2.985 2.991 2.999 3.048 2.992 0.012
No quad early-out 2.778 2.809 2.826 2.842 2.908 2.827 0.025

And just like that, another 0.17ms evaporate. I could do this all day. Let’s run the profiler again just to see what changed:

Rasterizer hotspots without early-out

Yes, branch mispredicts are down by about half, and cycles spent by about 10%. And we weren’t even that badly bottlenecked on branches to begin with, at least according to VTune! Just goes to show – CPUs really do like their code straight-line.

Bonus: per-pixel increments

There’s a few more minor modifications in the most recent set of changes that I won’t bother talking about, but there’s one more that I want to mention, and that several comments brought up last time: stepping the interpolated depth from pixel to pixel rather than recomputing it from the barycentric coordinates every time. I wanted to do this one last, because unlike our other changes, this one does change the resulting depth buffer noticeably. It’s not a huge difference, but changing the results is something I’ve intentionally avoided doing so far, so I wanted to do this change towards the end of the depth rasterizer modifications so it’s easier to “opt out” from.

That said, the change itself is really easy to make now: only do our current computation

VecF32 depth = zz[0] + itof(beta) * zz[1] + itof(gama) * zz[2];

once per line, and update depth incrementally per pixel (note that doing this properly requires changing the code a little bit, because the original code overwrites depth with the value we store to the depth buffer, but that’s easily changed):

depth += zx;

just like the edge equations themselves, where zx can be computed at setup time as

VecF32 zx = itof(aa1Inc) * zz[1] + itof(aa2Inc) * zz[2];

It should be easy to see why this produces the same results in exact arithmetic; but of course, in reality, there’s floating-point round-off error introduced in the computation of zx and by the repeated additions, so it’s not quite exact. That said, for our purposes (computing a depth buffer for occlusion culling), it’s probably fine. This gets rid of a lot of instructions in the loop, so it should come as no surprise that it’s faster, but let’s see by how much:

Change: Per-pixel depth increments

Version min 25th med 75th max mean sdev
Initial 3.367 3.420 3.432 3.445 3.512 3.433 0.021
End of part 1 3.020 3.081 3.095 3.106 3.149 3.093 0.020
Vec[SF]32 3.022 3.056 3.067 3.081 3.153 3.069 0.018
Setup cleanups 2.977 3.032 3.046 3.058 3.101 3.045 0.020
Binning fixes 2.972 3.008 3.022 3.035 3.079 3.022 0.020
No fixed-pt. Z/W 2.958 2.985 2.991 2.999 3.048 2.992 0.012
No quad early-out 2.778 2.809 2.826 2.842 2.908 2.827 0.025
Incremental depth 2.676 2.699 2.709 2.721 2.760 2.711 0.016

Down by about another 0.1ms per frame – which might be less than you expected considering how many instructions we just got rid of. What can I say – we’re starting to bump into other issues again.

Now, there’s more things we could try (isn’t there always?), but I think with five in-depth posts on rasterization and a 21% reduction in median run-time on what already started out as fairly optimized code, it’s time to close this chapter and start looking at other things. Which I will do in the next post. Until then, code for the new batch of changes is, as always, on Github.


Optimizing Software Occlusion Culling – index

$
0
0

In January of 2013, some nice folks at Intel released a Software Occlusion Culling demo with full source code. I spent about two weekends playing around with the code, and after realizing that it made a great example for various things I’d been meaning to write about for a long time, started churning out blog posts about it for the next few weeks. This is the resulting series.

Here’s the list of posts (the series is now finished):

  1. “Write combining is not your friend”, on typical write combining issues when writing graphics code.
  2. “A string processing rant”, a slightly over-the-top post that starts with some bad string processing habits and ends in a rant about what a complete minefield the standard C/C++ string processing functions and classes are whenever non-ASCII character sets are involved.
  3. “Cores don’t like to share”, on some very common pitfalls when running multiple threads that share memory.
  4. “Fixing cache issues, the lazy way”. You could redesign your system to be more cache-friendly – but when you don’t have the time or the energy, you could also just do this.
  5. “Frustum culling: turning the crank” – on the other hand, if you do have the time and energy, might as well do it properly.
  6. “The barycentric conspiracy” is a lead-in to some in-depth posts on the triangle rasterizer that’s at the heart of Intel’s demo. It’s also a gripping tale of triangles, Möbius, and a plot centuries in the making.
  7. “Triangle rasterization in practice” – how to build your own precise triangle rasterizer and not die trying.
  8. “Optimizing the basic rasterizer”, because this is real time, not amateur hour.
  9. “Depth buffers done quick, part 1″ – at last, looking at (and optimizing) the depth buffer rasterizer in Intel’s example.
  10. “Depth buffers done quick, part 2″ – optimizing some more!
  11. “The care and feeding of worker threads, part 1″ – this project uses multi-threading; time to look into what these threads are actually doing.
  12. “The care and feeding of worker threads, part 2″ – more on scheduling.
  13. “Reshaping dataflows” – using global knowledge to perform local code improvements.
  14. “Speculatively speaking” – on store forwarding and speculative execution, using the triangle binner as an example.
  15. “Mopping up” – a bunch of things that didn’t fit anywhere else.
  16. “The Reckoning” – in which a lesson is learned, but the damage is irreversible.

All the code is available on Github; there’s various branches corresponding to various (simultaneous) tracks of development, including a lot of experiments that didn’t pan out. The articles all reference the blog branch which contains only the changes I talk about in the posts – i.e. the stuff I judged to be actually useful.

Special thanks to Doug McNabb and Charu Chandrasekaran at Intel for publishing the example with full source code and a permissive license, and for saying “yes” when I asked them whether they were okay with me writing about my findings in this way!


CC0


To the extent possible under law,

Fabian Giesen

has waived all copyright and related or neighboring rights to
Optimizing Software Occlusion Culling.


The care and feeding of worker threads, part 1

$
0
0

This post is part of a series – go here for the index.

It’s time for another post! After all the time I’ve spent on squeezing about 20% out of the depth rasterizer, I figured it was time to change gears and look at something different again. But before we get started on that new topic, there’s one more set of changes that I want to talk about.

The occlusion test rasterizer

So far, we’ve mostly been looking at one rasterizer only – the one that actually renders the depth buffer we cull against, and even more precisely, only multi-threaded SSE version of it. But the occlusion culling demo has two sets of rasterizers: the other set is used for the occlusion tests. It renders bounding boxes for the various models to be tested and checks whether they are fully occluded. Check out the code if you’re interested in the details.

This is basically the same rasterizer that we already talked about. In the previous two posts, I talked about optimizing the depth buffer rasterizer, but most of the same changes apply to the test rasterizer too. It didn’t make sense to talk through the same thing again, so I took the liberty of just making the same changes (with some minor tweaks) to the test rasterizer “off-screen”. So, just a heads-up: the test rasterizer has changed while you weren’t looking – unless you closely watch the Github repository, that is.

And now that we’ve established that there’s another inner loop we ought to be aware of, let’s zoom out a bit and look at the bigger picture.

Some open questions

There’s two questions you might have if you’ve been following this series closely so far. The first concerns a very visible difference between the depth and test rasterizers that you might have noticed if you ran the code. It’s also visible in the data in “Depth buffers done quick, part 1″, though I didn’t talk about it at the time. I’m talking, of course, about the large standard deviation we get for the execution time of the occlusion tests. Here’s a set of measurements for the code right after bringing the test rasterizer up to date:

Pass min 25th med 75th max mean sdev
Render depth 2.666 2.716 2.732 2.745 2.811 2.731 0.022
Occlusion test 1.335 1.545 1.587 1.631 1.761 1.585 0.066

Now, the standard deviation actually got a fair bit lower with the rasterizer changes (originally, we were well above 0.1ms), but it’s still surprisingly large, especially considering that the occlusion tests run roughly half as long (in terms of wall-clock time) as the depth rendering. And there’s also a second elephant in the room that’s been staring us in the face for quite a while. Let me recycle one of the VTune screenshots from last time:

Rasterizer hotspots without early-out

Right there at #4 is some code from TBB, namely, what turns out to be the “thread is idle” spin loop.

Well, so far, we’ve been profiling, measuring and optimizing this as if it was a single-threaded application, but it’s not. The code uses TBB to dispatch tasks to worker threads, and clearly, a lot of these worker threads seem to be idle a lot of the time. But why? To answer that question, we need a bit different information than what either a normal VTune analysis run or our summary timers give us. We want a detailed breakdown of what happens during a frame. Now, VTune has some support for that (as part of their threading/concurrency profiling), but the UI doesn’t work well for me, and neither does the the visualization; it seems to be geared towards HPC/throughput computing more than latency-sensitive applications like real-time graphics, and it’s also still based on sampling profiling, which means it’s low-overhead but fairly limited in the kind of data it can collect.

Instead, I’m going to go for the shameless plug and use Telemetry instead (full disclosure: I work at RAD). It works like this: I manually instrument the source code to tell Telemetry when certain events are happening, and Telemetry collects that data, sends the whole log to a server and can later visualize it. Most games I’ve worked on have some kind of “bar graph profiler” that can visualize within-frame events, but because Telemetry keeps the whole data stream, it can also be used to answer the favorite question (not!) of engine programmers everywhere: “Wait, what the hell just happened there?”. Instead of trying to explain it in words, I’m just gonna show you the screenshot of my initial profiling run after I hooked up Telemetry and added some basic markup: (Click on the image to get the full-sized version)

Initial Telemetry run

The time axis goes from left to right, and all of the blocks correspond to regions of code that I’ve marked up. Regions can nest, and when they do, the blocks stack. I’m only using really basic markup right now, because that turns out to be all we need for the time being. The different tracks correspond to different threads.

As you can see, despite the code using TBB and worker threads, it’s fairly rare for more than 2 threads to be actually running anything interesting at a time. Also, if you look at the “Rasterize” and “DepthTest” tasks, you’ll notice that we’re spending a fair amount of time just waiting for the last 2 threads to finish their respective jobs, while the other worker threads are idle. That’s where our variance in latency ultimately comes from – it all depends on how lucky (or unlucky) we get with scheduling, and the exact scheduling of tasks changes every frame. And now that we’ve seen how much time the worker threads spend being idle, it also shouldn’t surprise us that TBB’s idle spin loop ranked as high as it did in the profile.

What do we do about it, though?

Let’s start with something simple

As usual, we go for the low-hanging fruit first, and if you look at the left side of the screenshot I’ll posted, you’ll see a lot of blocks (“zones”) on the left side of the screen. In fact, the count is much higher than you probably think – these are LOD zones, which means that Telemetry has grouped a bunch of very short zones into larger groups for the purposes of visualization. As you can see from the mouse-over text, the single block I’m pointing at with the mouse cursor corresponds to 583 zones – and each of those zones corresponds to an individual TBB task! That’s because this culling code uses one TBB task per model to be culled. Ouch. Let’s zoom in a bit:

Telemetry: occluder visibility, zoomed

Note that even at this zoom level (the whole screen covers about 1.3ms), most zones are still LOD’d out. I’ve mouse-over’ed on a single task that happens to hit one or two L3 cache miss and so is long enough (at about 1500 cycles) to show up individually, but most of these tasks are closer to 600 cycles. In total, frustum culling the approximately 1600 occluder models takes up just above 1ms, as the captions helpfully say. For reference, the much smaller block that says “OccludeesVisible” and takes about 0.1ms? That one actually processes about 27000 models (it’s the code we optimized in “Frustum culling: turning the crank”). Again, ouch.

Fortunately, there’s a simple solution: don’t use one task per model. Instead, use a smaller number of tasks (I just used 32) that each cover multiple models. The code is fairly obvious, so I won’t bother repeating it here, but I am going to show you the results:

Telemetry: Occluder culling fixed

Down from 1ms to 0.08ms in two minutes of work. Now we could apply the same level of optimization as we did to the occludee culling, but I’m not going to bother, because at least not for the time being it’s fast enough. And with that out of the way, let’s look at the rasterization and depth testing part.

A closer look

Let’s look a bit more closely at what’s going on during rasterization:

Rasterization close-up

There are at least two noteworthy things clearly visible in this screenshot:

  1. There’s three separate passes – transform, bin, then rasterize.
  2. For some reason, we seem to have an odd mixture of really long tasks and very short ones.

The former shouldn’t come as a surprise, since it’s explicit in the code:

gTaskMgr.CreateTaskSet(&DepthBufferRasterizerSSEMT::TransformMeshes, this,
    NUM_XFORMVERTS_TASKS, NULL, 0, "Xform Vertices", &mXformMesh);
gTaskMgr.CreateTaskSet(&DepthBufferRasterizerSSEMT::BinTransformedMeshes, this,
    NUM_XFORMVERTS_TASKS, &mXformMesh, 1, "Bin Meshes", &mBinMesh);
gTaskMgr.CreateTaskSet(&DepthBufferRasterizerSSEMT::RasterizeBinnedTrianglesToDepthBuffer, this,
    NUM_TILES, &mBinMesh, 1, "Raster Tris to DB", &mRasterize);	

// Wait for the task set
gTaskMgr.WaitForSet(mRasterize);

What the screenshot does show us, however, is the cost of those synchronization points. There sure is a lot of “air” in that diagram, and we could get some significant gains from squeezing it out. The second point is more of a surprise though, because the code does in fact try pretty hard to make sure the tasks are evenly sized. There’s a problem, though:

void TransformedModelSSE::TransformMeshes(...)
{
    if(mVisible)
    {
        // compute mTooSmall

        if(!mTooSmall)
        {
            // transform verts
        }
    }
}

void TransformedModelSSE::BinTransformedTrianglesMT(...)
{
    if(mVisible && !mTooSmall)
    {
        // bin triangles
    }
}

Just because we make sure each task handles an equal number of vertices (as happens for the “TransformMeshes” tasks) or an equal number of triangles (“BinTransformedTriangles”) doesn’t mean they are similarly-sized, because the work subdivision ignores culling. Evidently, the tasks end up not being uniformly sized – not even close. Looks like we need to do some load balancing.

Balancing act

To simplify things, I moved the computation of mTooSmall from TransformMeshes into IsVisible – right after the frustum culling itself. That required some shuffling arguments around, but it’s exactly the kind of thing we already saw in “Frustum culling: turning the crank”, so there’s little point in going over it in detail again.

Once TransformMeshes and BinTransformedTrianglesMT use the exact same condition – mVisible && !mTooSmall – we can determine the list of models that are visible and not too small once, compute how many triangles and vertices these models have in total, and then use these corrected numbers which account for the culling when we’re setting up the individual transform and binning tasks.

This is easy to do: DepthBufferRasterizerSSE gets a few more member variables

UINT *mpModelIndexA; // 'active' models = visible and not too small
UINT mNumModelsA;
UINT mNumVerticesA;
UINT mNumTrianglesA;

and two new member functions

inline void ResetActive()
{
    mNumModelsA = mNumVerticesA = mNumTrianglesA = 0;
}

inline void Activate(UINT modelId)
{
    UINT activeId = mNumModelsA++;
    assert(activeId < mNumModels1);

    mpModelIndexA[activeId] = modelId;
    mNumVerticesA += mpStartV1[modelId + 1] - mpStartV1[modelId];
    mNumTrianglesA += mpStartT1[modelId + 1] - mpStartT1[modelId];
}

that handle the accounting. The depth buffer rasterizer already kept cumulative vertex and triangle counts for all models; I added one more element at the end so I could use the simplified vertex/triangle-counting logic.

Then, at the end of the IsVisible pass (after the worker threads are done), I run

// Determine which models are active
ResetActive();
for (UINT i=0; i < mNumModels1; i++)
    if(mpTransformedModels1[i].IsRasterized2DB())
        Activate(i);

where IsRasterized2DB() is just a predicate that returns mIsVisible && !mTooSmall (it was already there, so I used it).

After that, all that remains is distributing work over the active models only, using mNumVerticesA and mNumTrianglesA. This is as simple as turning the original loop in TransformMeshes

for(UINT ss = 0; ss < mNumModels1; ss++)

into

for(UINT active = 0; active < mNumModelsA; active++)
{
    UINT ss = mpModelIndexA[active];
    // ...
}

and the same for BinTransformedMeshes. All in all, this took me about 10 minutes to write, debug and test. And with that, we should have proper load balancing for the first two passes of rendering: transform and binning. The question, as always, is: does it help?

Change: Better rendering “front end” load balancing

Version min 25th med 75th max mean sdev
Initial depth render 2.666 2.716 2.732 2.745 2.811 2.731 0.022
Balance front end 2.282 2.323 2.339 2.362 2.476 2.347 0.034

Oh boy, does it ever. That’s a 14.4% reduction on top of what we already got last time. And Telemetry tells us we’re now doing a much better job at submitting uniform-sized tasks:

Balanced rasterization front end

In this frame, there’s still one transform batch that takes longer than the others; this happens sometimes, because of context switches for example. But note that the other threads nicely pick up the slack, and we’re still fine: a ~2x variation on the occasional item isn’t a big deal, provided most items are still roughly the same size. Also note that, even though there’s 8 worker threads, we never seem to be running more than 4 tasks at a time, and the hand-offs between threads (look at what happens in the BinMeshes phase) seem too perfectly synchronized to just happen accidentally. I’m assuming that TBB intentionally never uses more than 4 threads because the machine I’m running this on has a quad-core CPU (albeit with HyperThreading), but I haven’t checked whether this is just a configuration option or not; it probably is.

Balancing the rasterizer back end

Now we can’t do the same trick for the actual triangle rasterization, because it works in tiles, and they just end up with uneven amounts of work depending on what’s on the screen – there’s nothing we can do about that. That said, we’re definitely hurt by the uneven task sizes here too – for example, on my original Telemetry screenshot, you can clearly see how the non-uniform job sizes hurt us:

Initial bad rasterizer balance

The green thread picks up a tile with lots of triangles to render pretty late, and as a result everyone else ends up waiting for him to finish. This is not good.

However, lucky for us, there’s a solution: the TBB task manager will parcel out tasks roughly in the order they were submitted. So all we have to do is to make sure the “big” tiles come first. Well, after binning is done, we know exactly how many triangles end up in each tile. So what we do is insert a single task between
binning and rasterization that determines the right order to process the tiles in, then make the actual rasterization depend on it:

gTaskMgr.CreateTaskSet(&DepthBufferRasterizerSSEMT::BinSort, this,
    1, &mBinMesh, 1, "BinSort", &sortBins);
gTaskMgr.CreateTaskSet(&DepthBufferRasterizerSSEMT::RasterizeBinnedTrianglesToDepthBuffer,
    this, NUM_TILES, &sortBins, 1, "Raster Tris to DB", &mRasterize);	

So how does that function look? Well, all we have to do is count how many triangles ended up in each triangle, and then sort the tiles by that. The function is so short I’m just gonna show you the whole thing:

void DepthBufferRasterizerSSEMT::BinSort(VOID* taskData,
    INT context, UINT taskId, UINT taskCount)
{
    DepthBufferRasterizerSSEMT* me =
        (DepthBufferRasterizerSSEMT*)taskData;

    // Initialize sequence in identity order and compute total
    // number of triangles in the bins for each tile
    UINT tileTotalTris[NUM_TILES];
    for(UINT tile = 0; tile < NUM_TILES; tile++)
    {
        me->mTileSequence[tile] = tile;

        UINT base = tile * NUM_XFORMVERTS_TASKS;
        UINT numTris = 0;
        for (UINT bin = 0; bin < NUM_XFORMVERTS_TASKS; bin++)
            numTris += me->mpNumTrisInBin[base + bin];

        tileTotalTris[tile] = numTris;
    }

    // Sort tiles by number of triangles, decreasing.
    std::sort(me->mTileSequence, me->mTileSequence + NUM_TILES,
        [&](const UINT a, const UINT b)
        {
            return tileTotalTris[a] > tileTotalTris[b]; 
        });
}

where mTileSequence is just an array of UINTs with NUM_TILES elements. Then we just rename the taskId parameter of RasterizeBinnedTrianglesToDepthBuffer to rawTaskId and start the function like this:

    UINT taskId = mTileSequence[rawTaskId];

and presto, we have bin sorting. Here’s the results:

Change: Sort back-end tiles by amount of work

Version min 25th med 75th max mean sdev
Initial depth render 2.666 2.716 2.732 2.745 2.811 2.731 0.022
Balance front end 2.282 2.323 2.339 2.362 2.476 2.347 0.034
Balance back end 2.128 2.162 2.178 2.201 2.284 2.183 0.029

Once again, we’re 20% down from where we started! Now let’s check in Telemetry to make sure it worked correctly and we weren’t just lucky:

Rasterizer fully balanced

Now that’s just beautiful. See how the whole thing is now densely packed into the live threads, with almost no wasted space? This is how you want your profiles to look. Aside from the fact that our rasterization only seems to be running on 3 threads, that is – there’s always more digging to do. One fun thing I noticed is that TBB actually doesn’t process the tasks fully in-order; the two top threads indeed start from the biggest tiles and work their way forwards, but the bottom-most thread actually starts from the end of the queue, working its way towards the beginning. The tiny LOD zone I’m hovering over covers both the bin sorting task and the seven smallest tiles; the packets get bigger from there.

And with that, I think we have enough changes (and images!) for one post. We’ll continue ironing out scheduling kinks next time, but I think the lesson is already clear: you can’t just toss tasks to worker threads and expect things to go smoothly. If you want to get good thread utilization, better profile to make sure your threads actually do what you think they’re doing! And as usual, you can find the code for this post on Github, albeit without the Telemetry instrumentation for now – Telemetry is a commercial product, and I don’t want to introduce any dependencies that make it harder for people to compile the code. Take care, and until next time.


The care and feeding of worker threads, part 2

$
0
0

This post is part of a series – go here for the index.

In the previous post, we took a closer look at what our worker threads were doing and spent some time load-balancing the depth buffer rasterizer to reduce our overall latency. This time, we’ll have a closer look at the rest of the system.

A bug

But first, it’s time to look at a bug that I inadvertently introduced last time: If you tried running the code from last time, you might have noticed that toggling the “Multi Tasking” checkbox off and back on causes a one-frame glitch. I introduced this bug in the changes corresponding to the section “Balancing act”. Since I didn’t get any comments or mails about it, it seems like I got away with it :), but I wanted to rectify it here anyway.

The issue turned out to be that the IsTooSmall computation for occluders, which we moved from the “vertex transform” to the “frustum cull” pass last time, used stale information. The relevant piece of the main loop is this:

mpCamera->SetNearPlaneDistance(1.0f);
mpCamera->SetFarPlaneDistance(gFarClipDistance);
mpCamera->Update();

// If view frustum culling is enabled then determine which occluders
// and occludees are inside the view frustum and run the software
// occlusion culling on only the those models
if(mEnableFCulling)
{
    renderParams.mpCamera = mpCamera;
    mpDBR->IsVisible(mpCamera);
    mpAABB->IsInsideViewFrustum(mpCamera);
}

// if software occlusion culling is enabled
if(mEnableCulling)
{
    mpCamera->SetNearPlaneDistance(gFarClipDistance);
    mpCamera->SetFarPlaneDistance(1.0f);
    mpCamera->Update();

    // Set the camera transforms so that the occluders can
    // be transformed 
    mpDBR->SetViewProj(mpCamera->GetViewMatrix(),
        (float4x4*)mpCamera->GetProjectionMatrix());

    // (clear, render depth and perform occlusion test here)

    mpCamera->SetNearPlaneDistance(1.0f);
    mpCamera->SetFarPlaneDistance(gFarClipDistance);
    mpCamera->Update();
}

Note how the call that actually updates the view-projection matrix (highlighted in red) runs after the frustum-culling pass. That’s the bug I was running into. Fixing this bug is almost as simple as moving that call up (to before the frustum culling pass), but another wrinkle is that the depth-buffer pass uses an inverted Z-buffer with Z=0 at the far plane and Z=1 at the near plane – note the calls that swap the positions of the camera “near” and “far” planes before depth buffer rendering, and the ones that swap it back after. There’s good reasons for doing this, particularly if the depth buffer uses floats (as it does in our implementation). But to simplify matters here, I changed the code to do the swapping as part of the viewport transform instead, which means there’s no need to be modifying the camera/projection setup during the frame at all. This keeps the code simpler and also makes it easy to move the SetViewProj call to before the frustum culling pass, where it should be now that we’re using these matrices earlier.

Some extra instrumentation

In some of the previous posts, we already looked at the frustum culling logic; this time, I also added another timer that measures our total culling time, including frustum culling and everything related to rendering the depth buffer and performing the bounding box occlusion tests. The code itself is straightforward; I just wanted to add another explicit counter so we can see the explicit summary statistics as we make changes. I’ll use separate tables for the individual measurements:

Total cull time min 25th med 75th max mean sdev
Initial 3.767 3.882 3.959 4.304 5.075 4.074 0.235
Render depth min 25th med 75th max mean sdev
Initial 2.098 2.119 2.132 2.146 2.212 2.136 0.022
Depth test min 25th med 75th max mean sdev
Initial 1.249 1.366 1.422 1.475 1.656 1.425 0.081

Load balancing depth testing

Last time, we saw two fundamentally different ways to balance our multi-threaded workloads. The first was to simply split the work into N contiguous chunks. As we saw for the “transform vertices” and “bin meshes” passes, this works great provided that the individual work items generate a roughly uniform amount of work. Since vertex transform and binning work were roughly proportional to the number of vertices and triangles respectively, this kind of split worked well once we made sure to split after early-out processing.

In the second case, triangle rasterization, we couldn’t change the work partition after the fact: each task corresponded to one tile, and if we started touching two tiles in one task, it just wouldn’t work; there’d be race conditions. But at least we had a rough metric of how expensive each tile was going to be – the number of triangles in the respective bins – and we could use that to make sure that the “bulky” tiles would get processed first, to reduce the risk of picking up such a tile late and then having all other threads wait for its processing to finish.

Now, the depth tests are somewhat tricky, because neither of these strategies really apply. The cost of depth-testing a bounding box has two components: first, there is a fixed overhead of just processing a box (transforming its vertices and setting up the triangles), and second, there’s the actual rasterization with a cost that’s roughly proportional to the size of the bounding box in pixels when projected to the screen. For small boxes, the constant overhead is the bigger issue; for larger boxes, the per-pixel cost dominates. And at the point when we’re partitioning the work items across threads, we don’t know how big an area a box is going to cover on the screen, because we haven’t transformed the vertices yet! But still, our depth test pass is in desperate need of some balancing – here’s a typical example:

Imbalanced depth tests

There’s nothing that’s stopping us from treating the depth test pass the way we treat the regular triangle pass: chop it up into separate phases with explicit hand-overs and balance them separately. But that’s a really big and disruptive change, and it turns out we don’t have to go that far to get a decent improvement.

The key realization is that the array of model bounding boxes we’re traversing is not in a random order. Models that are near each other in the world also tend to be near each other in the array. Thus, when we just partition the list of world models into N separate contiguous chunks, they’re not gonna have a similar amount of work for most viewpoints: some chunks are closer to the viewer than others, and those will contain bounding boxes that take up more area on the screen and hence be more expensive to process.

Well, that’s easy enough to fix: don’t do that! Suppose we had two worker threads. Our current approach would then correspond to splitting the world database in the middle, giving the first half to the first worker, and the second half to the second worker. This is bad whenever there’s much more work in one of the halves, say because the camera happens to be in it and the models are just bigger on screen and take longer to depth-test. But there’s no need to split the world database like that! We can just as well split it non-contiguously, say into one half with even indices and another half with odd indices. We can still get a lopsided distribution, but only if we happen to be a lot closer to all the even-numbered models than we are to the odd-numbered ones, and that’s a lot less likely to happen by accident. Unless the meshes happen to form a grid or other regular structure that is, in which case you might still get screwed. :)

Anyway, the same idea generalizes to N threads: instead of partitioning the models into odd and even halves, group all models which have the same index mod N. And in practice we don’t want to interleave at the level of individual models, since them being close together also has an advantage: they tend to hit similar regions of the depth buffer, which have a good chance of being in the cache. So instead of interleaving at the level of individual models, we interleave groups of 64 (arbitrary choice!) models at a time; an idea similar to the disk striping used for RAIDs. It turns out to be a really easy change to make: just replace the original loop

for(UINT i = start; i < end; i++)
{
    // process model i
}

with the only marginally more complicated

static const UINT kChunkSize = 64;
for(UINT base = taskId*kChunkSize; base < mNumModels;
        base += mNumDepthTestTasks * kChunkSize)
{
    UINT end = min(base + kChunkSize, mNumModels);
    for(UINT i = base; i < end; i++)
    {
        // process model i
    }
}

and we’re done. Let’s see the change:

Change: “Striping” to load-balance depth test threads.

Depth test min 25th med 75th max mean sdev
Initial 1.249 1.366 1.422 1.475 1.656 1.425 0.081
Striped 1.109 1.152 1.166 1.182 1.240 1.167 0.022
Total cull time min 25th med 75th max mean sdev
Initial 3.767 3.882 3.959 4.304 5.075 4.074 0.235
Striped depth test 3.646 3.769 3.847 3.926 4.818 3.877 0.160

That’s pretty good for just changing a few lines. Here’s the corresponding Telemetry screenshot:

Depth tests after striping

Not as neatly balanced as some of the other ones we’ve seen, but we successfully managed to break up some of the huge packets, so it’s good enough for now.

One bottleneck remaining

At this point, we’re in pretty good shape as far as worker thread utilization is concerned, but there’s one big serial chunk still remaining, right between frustum culling and vertex transformation:

Depth buffer clears

Clearing the depth buffer. This is about 0.4ms, about a third of the time we spend depth testing, all tracing back to a single line in the code:

    // Clear the depth buffer
    mpCPURenderTargetPixels = (UINT*)mpCPUDepthBuf;
    memset(mpCPURenderTargetPixels, 0, SCREENW * SCREENH * 4);

Luckily, this one’s really easy to fix. We could try and turn this into another separate group of tasks, but there’s no need: we already have a pass that chops up the screen into several smaller pieces, namely the actual rasterization which works one tile at a time. And neither the vertex transform nor the binner that run before it actually care about the contents of the depth buffer. So we just clear one tile at a time, from the rasterizer code. As a bonus, this means that the active tile gets “pre-loaded” into the current core’s L2 cache before we start rendering. I’m not going to bother walking through the code here – it’s simple enough – but as usual, I’ll give you the results:

Change: Clear depth buffer in rasterizer workers

Total cull time min 25th med 75th max mean sdev
Initial 3.767 3.882 3.959 4.304 5.075 4.074 0.235
Striped depth test 3.646 3.769 3.847 3.926 4.818 3.877 0.160
Clear in rasterizer 3.428 3.579 3.626 3.677 4.734 3.658 0.155
Render depth min 25th med 75th max mean sdev
Initial 2.098 2.119 2.132 2.146 2.212 2.136 0.022
Clear in rasterizer 2.191 2.224 2.248 2.281 2.439 2.258 0.043

So even though we take a bit of a hit in rasterization latency, we still get a very solid 0.2ms win in the total cull time. Again, a very good pay-off considering the amount of work involved.

Summary

A lot of the posts in this series so far either needed conceptual/algorithmic leaps or at least some detailed micro-architectural profiling. But this post and the previous one did not. In fact, finding these problems took nothing but a timeline profiler, and none of the fixes were particularly complicated either. I used Telemetry because that’s what I’m familiar with, but I didn’t use any but its most basic features, and I’m sure you would’ve found the same problems with any other program of this type; I’m told Intel’s GPA can do the same thing, but I haven’t used it so far.

Just to drive this one home – this is what we started with:

Initial work distribution

(total cull time 7.36ms, for what it’s worth) and this is where we are now:

Finished worker balance

Note that the bottom one is zoomed in by 2x so you can read the labels! Compare the zone lengths where printed. Now, this is not a representative sample; I just grabbed an arbitrary frame from both sessions, so don’t draw any conclusions from these two images alone, but it’s still fairly impressive. I’m still not sure why TBB only seems to use some subset of its worker threads – maybe there’s some threshold before they wake up and our parallel code just doesn’t run for long enough? – but it should be fairly obvious that the overall packing is a lot better now.

Remember, people. This is the same code. I didn’t change any of the algorithms nor their implementations in any substantial way. All I did was spend some time on their callers, improving the work granularity and scheduling. If you’re using worker threads, this is absolutely something you need to have on your radar.

As usual, the code for this part is up on Github, this time with a few bonus commits I’m going to discuss next time (spoiler alert!), when I take a closer look at the depth testing code and the binner. See you then!


Reshaping dataflows

$
0
0

This post is part of a series – go here for the index.

Welcome back! So far, we’ve spent quite some time “zoomed in” on various components of the Software Occlusion Culling demo, looking at various micro-architectural pitfalls and individual loops. In the last two posts, we “zoomed out” and focused on the big picture: what work runs when, and how to keep all cores busy. Now, it’s time to look at what lies in between: the plumbing, if you will. We’ll be looking at the dataflows between subsystems and modules and how to improve them.

This is one of my favorite topics in optimization, and it’s somewhat under-appreciated. There’s plenty of material on how to make loops run fast (although a lot of it is outdated or just wrong, so beware), and at this point there’s plenty of ways of getting concurrency up and running: there’s OpenMP, Intel’s TBB, Apple’s GCD, Windows Thread Pools and ConcRT for CPU, there’s OpenCL, CUDA and DirectCompute for jobs that are GPU-suitable, and so forth; you get the idea. The point being that it’s not hard to find a shrink-wrap solution that gets you up and running, and a bit of profiling (like we just did) is usually enough to tell you what needs to be done to make it all go smoothly.

But back to the topic at hand: improving dataflow. The problem is that, unlike the other two aspects I mentioned, there’s really no recipe to follow; it’s very much context-dependent. It basically boils down to looking at both sides of the interface between systems and functions and figuring out if there’s a better way to handle that interaction. We’ve seen a bit of that earlier when talking about frustum culling; rather than trying to define it in words, I’ll just do it by example, so let’s dive right in!

A simple example

A good example is the member variable TransformedAABBoxSSE::mVisible, declared like this:

bool *mVisible;

A pointer to a bool. So where does that pointer come from?

inline void SetVisible(bool *visible){mVisible = visible;}

It turns out that the constructor initializes this pointer to NULL, and the only method that ever does anything with mVisible is RasterizeAndDepthTestAABBox, which executes *mVisible = true; if the bounding box is found to be visible. So how does this all get used?

mpVisible[i] = false;
mpTransformedAABBox[i].SetVisible(&mpVisible[i]);
if(...)
{
    mpTransformedAABBox[i].TransformAABBox();
    mpTransformedAABBox[i].RasterizeAndDepthTestAABBox(...);
}

That’s it. That’s the only call sites. There’s really no reason for mVisible to be state – semantically, it’s just a return value for RasterizeAndDepthTestAABBox, so that’s what it should be – always try to get rid of superfluous state. This doesn’t even have anything to do with optimization per se; explicit dataflow is easy for programmers to see and reason about, while implicit dataflow (through pointers, members and state) is hard to follow (both for humans and compilers!) and error-prone.

Anyway, making this return value explicit is really basic, so I’m not gonna walk through the details; you can always look at the corresponding commit. I won’t bother benchmarking this change either.

A more interesting case

In the depth test rasterizer, right after determining the bounding box, there’s this piece of code:

for(int vv = 0; vv < 3; vv++) 
{
    // If W (holding 1/w in our case) is not between 0 and 1,
    // then vertex is behind near clip plane (1.0 in our case).
    // If W < 1 (for W>0), and 1/W < 0 (for W < 0).
    VecF32 nearClipMask0 = cmple(xformedPos[vv].W, VecF32(0.0f));
    VecF32 nearClipMask1 = cmpge(xformedPos[vv].W, VecF32(1.0f));
    VecS32 nearClipMask = float2bits(or(nearClipMask0,
        nearClipMask1));

    if(!is_all_zeros(nearClipMask))
    {
        // All four vertices are behind the near plane (we're
        // processing four triangles at a time w/ SSE)
        return true;
    }
}

Okay. The transform code sets things up so that the “w” component of the screen-space positions actually contains 1/w; the first part of this code then tries to figure out whether the source vertex was in front of the near plane (i.e. outside the view frustum or not). An ugly wrinkle here is that the near plane is hard-coded to be at 1. Doing this after dividing by w adds extra complications since the code needs to be careful about the signs. And the second comment is outright wrong – it in fact early-outs when any of the four active triangles have vertex number vv outside the near-clip plane, not when all of them do. In other words, if any of the 4 active triangles get near-clipped, the test rasterizer will just punt and return true (“visible”).

So here’s the thing: there’s really no reason to do this check after we’re done with triangle setup. Nor do we even have to gather the 3 triangle vertices to discover that one of them is in front of the near plane. A box has 8 vertices, and we’ll know whether any of them are in front of the near plane as soon as we’re done transforming them, before we even think about triangle setup! So let’s look at the function that transforms the vertices:

void TransformedAABBoxSSE::TransformAABBox()
{
    for(UINT i = 0; i < AABB_VERTICES; i++)
    {
        mpXformedPos[i] = TransformCoords(&mpBBVertexList[i],
            mCumulativeMatrix);
        float oneOverW = 1.0f/max(mpXformedPos[i].m128_f32[3],
            0.0000001f);
        mpXformedPos[i] = mpXformedPos[i] * oneOverW;
        mpXformedPos[i].m128_f32[3] = oneOverW;
    }
}

As we can see, returning 1/w does in fact take a bit of extra work, so we’d like to avoid it, especially since that 1/w is really only referenced by the near-clip checking code. Also, the code seems to clamp w at some arbitrary small positive value – which means that the part of the near clip computation in the depth test rasterizer that worries about w<0 is actually unnecessary. This is the kind of thing I’m talking about – each piece of code in isolation seems reasonable, but once you look at both sides it becomes clear that the pieces don’t fit together all that well.

It turns out that after TransformCoords, we’re in “homogeneous viewport space”, i.e. we’re still in a homogeneous space, but unlike the homogeneous clip space you might be used to from vertex shaders, this one also has the viewport transform baked in. But our viewport transform leaves z alone (we fixed that in the previous post!), so we still have a D3D-style clip volume for z:

0 \le z \le w

Since we’re using a reversed clip volume, the z≤w constraint is the near-plane one. Note that this test doesn’t need any special cases for negative signs and also doesn’t have a hardcoded near-plane location any more: it just automatically uses whatever the projection matrix says, which is the right thing to do!

Even better, if we test for near-clip anyway, there’s no need to clamp w at all. We know that anything with w≤0 is outside the near plane, and if a vertex is outside the near plane we’re not gonna rasterize the box anyway. Now we might still end up dividing by 0, but since we’re dealing with floats, this is a well-defined operation (it might return infinities or NaNs, but that’s fine).

And on the subject of not rasterizing the box: as I said earlier, as soon as one vertex is outside the near-plane, we know we’re going to return true from the depth test rasterizer, so there’s no point even starting the operation. To facilitate this, we just make TransformAABBox return whether the box should be rasterized or not. Putting it all together:

bool TransformedAABBoxSSE::TransformAABBox()
{
    __m128 zAllIn = _mm_castsi128_ps(_mm_set1_epi32(~0));

    for(UINT i = 0; i < AABB_VERTICES; i++)
    {
        __m128 vert = TransformCoords(&mpBBVertexList[i],
            mCumulativeMatrix);

        // We have inverted z; z is inside of near plane iff z <= w.
        __m128 vertZ = _mm_shuffle_ps(vert, vert, 0xaa); //vert.zzzz
        __m128 vertW = _mm_shuffle_ps(vert, vert, 0xff); //vert.wwww
        __m128 zIn = _mm_cmple_ps(vertZ, vertW);
        zAllIn = _mm_and_ps(zAllIn, zIn);

        // project
        mpXformedPos[i] = _mm_div_ps(vert, vertW);
    }

    // return true if and only if all verts inside near plane
    return _mm_movemask_ps(zAllIn) == 0xf;
}

In case you’re wondering why this code uses raw SSE intrinsics and not VecF32, it’s because I’m purposefully trying to keep anything depending on the SIMD width out of VecF32, which makes it a lot easier to go to 8-wide AVX should we want to at some point. But this code really uses 4-vectors of (x,y,z,w) and needs to do shuffles, so it doesn’t fit in that model and I want to keep it separate. But the actual logic is just what I described.

And once we have this return value from TransformAABBox, we get to remove the near-clip test from the depth test rasterizer, and we get to move our early-out for near-clipped boxes all the way to the call site:

if(mpTransformedAABBox[i].TransformAABBox())
    mpVisible[i] = mpTransformedAABBox[i].RasterizeAndDepthTestAABBox(...);
else
    mpVisible[i] = true;

So, the oneOverW hack, the clamping hack and the hard-coded near plane are gone. That’s already a victory in terms of code quality, but did it improve the run time?

Change: Transform/early-out fixes

Depth test min 25th med 75th max mean sdev
Start 1.109 1.152 1.166 1.182 1.240 1.167 0.022
Transform fixes 1.054 1.092 1.102 1.112 1.146 1.102 0.016

Another 0.06ms off our median depth test time, which may not sound big but is over 5% of what’s left of it at this point.

Getting warmer

The bounding box rasterizer has one more method that’s called per-box though, and this is one that really deserves some special attention. Meet IsTooSmall:

bool TransformedAABBoxSSE::IsTooSmall(__m128 *pViewMatrix,
    __m128 *pProjMatrix, CPUTCamera *pCamera)
{
    float radius = mBBHalf.lengthSq(); // Use length-squared to
    // avoid sqrt().  Relative comparisons hold.

    float fov = pCamera->GetFov();
    float tanOfHalfFov = tanf(fov * 0.5f);

    MatrixMultiply(mWorldMatrix, pViewMatrix, mCumulativeMatrix);
    MatrixMultiply(mCumulativeMatrix, pProjMatrix,
        mCumulativeMatrix);
    MatrixMultiply(mCumulativeMatrix, mViewPortMatrix,
        mCumulativeMatrix);

    __m128 center = _mm_set_ps(1.0f, mBBCenter.z, mBBCenter.y,
        mBBCenter.x);
    __m128 mBBCenterOSxForm = TransformCoords(&center,
        mCumulativeMatrix);
    float w = mBBCenterOSxForm.m128_f32[3];
    if( w > 1.0f )
    {
        float radiusDivW = radius / w;
        float r2DivW2DivTanFov = radiusDivW / tanOfHalfFov;

        return r2DivW2DivTanFov <
            (mOccludeeSizeThreshold * mOccludeeSizeThreshold);
    }

    return false;
}

Note that MatrixMultiply(A, B, C) performs C = A * B; the rest should be easy enough to figure out from the code. Now there’s really several problems with this function, so let’s go straight to a list:

  • radius (which is really radius squared) only depends on mBBHalf, which is fixed at initialization time. There’s no need to recompute it every time.
  • Similarly, fov and tanOfHalfFov only depend on the camera, and absolutely do not need to be recomputed once for every box. This is what gave us the _tan_pentium4 cameo all the way back in “Frustum culling: turning the crank”, by the way.
  • The view matrix, projection matrix and viewport matrix are also all camera or global constants. Again, no need to multiply these together for every box – the only matrix that is different between boxes is the very first one, the world matrix, and since matrix multiplication is associative, we can just concatenate the other three once.
  • There’s also no need for mOccludeeSizeThreshold to be squared every time – we can do that once.
  • Nor is there a need for it to be stored per box, since it’s a global constant owned by the depth test rasterizer.
  • (radius / w) / tanOfHalfFov would be better computed as radius / (w * tanOfHalfFov).
  • But more importantly, since all we’re doing is a compare and both w and tanOfHalfFov are positive, we can just multiply through by them and get rid of the divide altogether.

All these things are common problems that I must have fixed a hundred times, but I have to admit that it’s pretty rare to see so many of them in a single page of code. Anyway, rather than fixing these one by one, let’s just cut to the chase: instead of all the redundant computations, we just move everything that only depends on the camera (or is global) into a single struct that holds our setup, which I dubbed BoxTestSetup. Here’s the code:

struct BoxTestSetup
{
    __m128 mViewProjViewport[4];
    float radiusThreshold;

    void Init(const __m128 viewMatrix[4],
        const __m128 projMatrix[4], CPUTCamera *pCamera,
        float occludeeSizeThreshold);
};

void BoxTestSetup::Init(const __m128 viewMatrix[4],
    const __m128 projMatrix[4], CPUTCamera *pCamera,
    float occludeeSizeThreshold)
{
    // viewportMatrix is a global float4x4; we need a __m128[4]
    __m128 viewPortMatrix[4];
    viewPortMatrix[0] = _mm_loadu_ps((float*)&viewportMatrix.r0);
    viewPortMatrix[1] = _mm_loadu_ps((float*)&viewportMatrix.r1);
    viewPortMatrix[2] = _mm_loadu_ps((float*)&viewportMatrix.r2);
    viewPortMatrix[3] = _mm_loadu_ps((float*)&viewportMatrix.r3);

    MatrixMultiply(viewMatrix, projMatrix, mViewProjViewport);
    MatrixMultiply(mViewProjViewport, viewPortMatrix,
        mViewProjViewport);

    float fov = pCamera->GetFov();
    float tanOfHalfFov = tanf(fov * 0.5f);
    radiusThreshold = occludeeSizeThreshold * occludeeSizeThreshold
        * tanOfHalfFov;
}

This is initialized once we start culling and simply kept on the stack. Then we just pass it to IsTooSmall, which after our surgery looks like this:

bool TransformedAABBoxSSE::IsTooSmall(const BoxTestSetup &setup)
{
    MatrixMultiply(mWorldMatrix, setup.mViewProjViewport,
        mCumulativeMatrix);

    __m128 center = _mm_set_ps(1.0f, mBBCenter.z, mBBCenter.y,
        mBBCenter.x);
    __m128 mBBCenterOSxForm = TransformCoords(&center,
        mCumulativeMatrix);
    float w = mBBCenterOSxForm.m128_f32[3];
    if( w > 1.0f )
    {
        return mRadiusSq < w * setup.radiusThreshold;
    }

    return false;
}

Wow, that method sure seems to have lost a few pounds. Let’s run the numbers:

Change: IsTooSmall cleanup

Depth test min 25th med 75th max mean sdev
Start 1.109 1.152 1.166 1.182 1.240 1.167 0.022
Transform fixes 1.054 1.092 1.102 1.112 1.146 1.102 0.016
IsTooSmall cleanup 0.860 0.893 0.908 0.917 0.954 0.905 0.018

Another 0.2ms off the median run time, bringing our total reduction for this post to about 22%. So are we done? Not yet!

The state police

Currently, each TransformedAABBoxSSE still keeps its own copy of the cumulative transform matrix and a copy of its transformed vertices. But it’s not necessary for these to be persistent – we compute them once, use them to rasterize the box, then don’t look at them again until the next frame. So, like mVisible earlier, there’s really no need to keep them around as state; instead, it’s better to just store them on the stack. Less pointers per TransformedAABBoxSSE, less cache misses, and – perhaps most important of all – it makes the bounding box objects themselves stateless. Granted, that’s the case only because our world is perfectly static and nothing is animated at runtime, but still, stateless is good! Stateless is easier to read, easier to debug, and easier to test.

Again, this is another change that is purely mechanical – just pass in a pointer to cumulativeMatrix and xformedPos to the functions that want them. So this time, I’m just going to refer you directly to the two commits that implement this idea, and skip straight to the results:

Change: Reduce amount of state

Depth test min 25th med 75th max mean sdev
Start 1.109 1.152 1.166 1.182 1.240 1.167 0.022
Transform fixes 1.054 1.092 1.102 1.112 1.146 1.102 0.016
IsTooSmall cleanup 0.860 0.893 0.908 0.917 0.954 0.905 0.018
Reduce state 0.834 0.862 0.873 0.886 0.938 0.875 0.017

Only about 0.03ms this time, but we also save 192 bytes (plus allocator overhead) worth of memory per box, which is a nice bonus. And anyway, we’re not done yet, because I have one more!

It’s more fun to compute

There’s one more piece of unnecessary data we currently store per bounding box: the vertex list, initialized in CreateAABBVertexIndexList:

float3 min = mBBCenter - bbHalf;
float3 max = mBBCenter + bbHalf;
	
//Top 4 vertices in BB
mpBBVertexList[0] = _mm_set_ps(1.0f, max.z, max.y, max.x);
mpBBVertexList[1] = _mm_set_ps(1.0f, max.z, max.y, min.x); 
mpBBVertexList[2] = _mm_set_ps(1.0f, min.z, max.y, min.x);
mpBBVertexList[3] = _mm_set_ps(1.0f, min.z, max.y, max.x);
// Bottom 4 vertices in BB
mpBBVertexList[4] = _mm_set_ps(1.0f, min.z, min.y, max.x);
mpBBVertexList[5] = _mm_set_ps(1.0f, max.z, min.y, max.x);
mpBBVertexList[6] = _mm_set_ps(1.0f, max.z, min.y, min.x);
mpBBVertexList[7] = _mm_set_ps(1.0f, min.z, min.y, min.x);

This is, in effect, just treating the bounding box as a general mesh. But that’s extremely wasteful – we already store center and half-extent, the min/max corner positions are trivial to reconstruct from that information, and all the other vertices can be constructed by splicing min/max together componentwise using a set of masks that is the same for all bounding boxes. So these 8*16 = 128 bytes of vertex data really don’t pay their way.

But more importantly, note that the we only ever use two distinct values for x, y and z each. Now TransformAABBox, which we already saw above, uses TransformCoords to compute the matrix-vector product v*M with the cumulative transform matrix, using the expression

v.x * M.row[0] + v.y * M.row[1] + v.z * M.row[2] + M.row[3] (v.w is assumed to be 1)

and because we know that v.x is either min.x or max.x, we can multiply both by M.row[0] once and store the result. Then the 8 individual vertices can skip the multiplies altogether. Putting it all together leads to the following new code for TransformAABBox:

// 0 = use min corner, 1 = use max corner
static const int sBBxInd[AABB_VERTICES] = { 1, 0, 0, 1, 1, 1, 0, 0 };
static const int sBByInd[AABB_VERTICES] = { 1, 1, 1, 1, 0, 0, 0, 0 };
static const int sBBzInd[AABB_VERTICES] = { 1, 1, 0, 0, 0, 1, 1, 0 };

bool TransformedAABBoxSSE::TransformAABBox(__m128 xformedPos[],
    const __m128 cumulativeMatrix[4])
{
    // w ends up being garbage, but it doesn't matter - we ignore
    // it anyway.
    __m128 vCenter = _mm_loadu_ps(&mBBCenter.x);
    __m128 vHalf   = _mm_loadu_ps(&mBBHalf.x);

    __m128 vMin    = _mm_sub_ps(vCenter, vHalf);
    __m128 vMax    = _mm_add_ps(vCenter, vHalf);

    // transforms
    __m128 xRow[2], yRow[2], zRow[2];
    xRow[0] = _mm_shuffle_ps(vMin, vMin, 0x00) * cumulativeMatrix[0];
    xRow[1] = _mm_shuffle_ps(vMax, vMax, 0x00) * cumulativeMatrix[0];
    yRow[0] = _mm_shuffle_ps(vMin, vMin, 0x55) * cumulativeMatrix[1];
    yRow[1] = _mm_shuffle_ps(vMax, vMax, 0x55) * cumulativeMatrix[1];
    zRow[0] = _mm_shuffle_ps(vMin, vMin, 0xaa) * cumulativeMatrix[2];
    zRow[1] = _mm_shuffle_ps(vMax, vMax, 0xaa) * cumulativeMatrix[2];

    __m128 zAllIn = _mm_castsi128_ps(_mm_set1_epi32(~0));

    for(UINT i = 0; i < AABB_VERTICES; i++)
    {
        // Transform the vertex
        __m128 vert = cumulativeMatrix[3];
        vert += xRow[sBBxInd[i]];
        vert += yRow[sBByInd[i]];
        vert += zRow[sBBzInd[i]];

        // We have inverted z; z is inside of near plane iff z <= w.
        __m128 vertZ = _mm_shuffle_ps(vert, vert, 0xaa); //vert.zzzz
        __m128 vertW = _mm_shuffle_ps(vert, vert, 0xff); //vert.wwww
        __m128 zIn = _mm_cmple_ps(vertZ, vertW);
        zAllIn = _mm_and_ps(zAllIn, zIn);

        // project
        xformedPos[i] = _mm_div_ps(vert, vertW);
    }

    // return true if and only if none of the verts are z-clipped
    return _mm_movemask_ps(zAllIn) == 0xf;
}

Admittedly, quite a bit longer than the original one, but that’s because we front-load a lot of the computation; most of the per-vertex work done in TransformCoords is gone. And here’s our reward:

Change: Get rid of per-box vertex list

Depth test min 25th med 75th max mean sdev
Start 1.109 1.152 1.166 1.182 1.240 1.167 0.022
Transform fixes 1.054 1.092 1.102 1.112 1.146 1.102 0.016
IsTooSmall cleanup 0.860 0.893 0.908 0.917 0.954 0.905 0.018
Reduce state 0.834 0.862 0.873 0.886 0.938 0.875 0.017
Remove vert list 0.801 0.823 0.830 0.839 0.867 0.831 0.012

This brings our total for this post to a nearly 25% reduction in median depth test time, plus about 320 bytes memory reduction per TransformedAABBoxSSE – which, since we have about 27000 of them, works out to well over 8 megabytes. Such are the rewards for widening the scope beyond optimizing functions by themselves.

And as usual, the code for this time (plus some changes I haven’t discussed yet) is up on Github. Until next time!


Speculatively speaking

$
0
0

This post is part of a series – go here for the index.

Welcome back! Today, it’s time to take a closer look at the triangle binning code, which we’ve only seen mentioned briefly so far, and we’re going to see a few more pitfalls that all relate to speculative execution.

Loads blocked by what?

There’s one more micro-architectural issue this program runs into that I haven’t talked about before. Here’s the obligatory profiler screenshot:

Store-to-load forwarding issues

The full column name reads “Loads Blocked by Store Forwarding”. So, what’s going on there? For this one, I’m gonna have to explain a bit first.

So let’s talk about stores in an out-of-order processor. In this series, we already saw how conditional branches and memory sharing between cores get handled on modern x86 cores: namely, with speculative execution. For branches, the core tries to predict which direction they will go, and automatically starts fetching and executing the corresponding instructions. Similarly, memory accesses are assumed to not conflict with what other cores are doing at the same time, and just march on ahead. But if it later turns out that the branch actually went in the other direction, that there was a memory conflict, or that some exception / hardware interrupt occurred, all the instructions that were executed in the meantime are invalid and their results must be discarded – the speculation didn’t pan out. The implicit assumption is that our speculation (branches behave as predicted, memory accesses generally don’t conflict and CPU exceptions/interrupts are rare) is right most of the time, so it generally pays off to forge ahead, and the savings are worth the occasional extra work of undoing a bunch of instructions when we turned out to be wrong.

But wait, how does the CPU “undo” instructions? Well, conceptually it takes a “snapshot” of the current machine state every time it’s about to start an operation that it might later have to undo. If that instructions makes it all the way through the pipeline without incident, it just gets retired normally, the snapshot gets thrown away and we know that our speculation was successful. But if there is a problem somewhere, the machine can just throw away all the work it did in the meantime, rewind back to the snapshot and retry.

Of course, CPUs don’t actually take full snapshots. Instead, they make use of the out-of-order machinery to do things much more efficiently: out-of-order CPUs have more registers internally than are exposed in the ISA (Instruction Set Architecture), and use a technique called “register renaming” to map the small set of architectural registers onto the larger set of physical registers. The “snapshotting” then doesn’t actually need to save register contents; it just needs to keep track of what the current register mapping at the snapshot point was, and make sure that the associated physical registers from the “before” snapshot don’t get reused until the instruction is safely retired.

This takes care of register modifications. We already know what happens with loads from memory – we just run them, and if it later turns out that the memory contents changed between the load instruction’s execution and its retirement, we need to re-run that block of code. Stores are the tricky part: we can’t easily do “memory renaming” since memory (unlike registers) is a shared resource, and also unlike registers rarely gets written in whole “accounting units” (cache lines) at a time.

The solution are store buffers: when a store instruction is executed, we do all the necessary groundwork – address translation, access right checking and so forth – but don’t actually write to memory just yet; rather, the target address and the associated data bits are written into a store buffer, where they just sit around for a while; the store buffers form a log of all pending writes to memory. Only after the core is sure that the store instruction will actually be executed (branch results etc. are known and no exceptions were triggered) will these values actually be written back to the cache.

Buffering stores this way has numerous advantages (beyond just making speculation easier), and is a technique not just used in out-of-order architectures; there’s just one problem though: what happens if I run code like this?

  mov  [x], eax
  mov  ebx, [x]

Assuming no other threads writing to the same memory at the same time, you would certainly hope that at the end of this instruction sequence, eax and ebx contain the same value. But remember that the first instruction (the store) just writes to a store buffer, whereas the second instruction (the load) normally just references the cache. At the very least, we have to detect that this is happening – i.e., that we are trying to load from an address that currently has a write logged in a store buffer – but there’s numerous things we could do with that information.

One option is to simply stall the core and wait until the store is done before the load can start. This is fairly cheap to implement in hardware, but it does slow down the software running on it. This option was chosen by the in-order cores used in the current generation of game consoles, and the result is the dreaded “Load Hit Store” stall. It’s a way to solve the problem, but let’s just say it won’t win you many friends.

So x86 cores normally use a technique called “store to load forwarding” or just “store forwarding”, where loads can actually read data directly from the store buffers, at least under certain conditions. This is much more expensive in hardware – it adds a lot of wires between the load unit and the store buffers – but it is far less finicky to use on the software side.

So what are the conditions? The details depend on the core in question. Generally, if you store a value to a naturally aligned location in memory, and do a load with the same size as the store, you can expect store forwarding to work. If you do trickier stuff – span multiple cache lines, or use mismatched sizes between the loads and stores, for example – it really does depend. Some of the more recent Intel cores can also forward larger stores into smaller loads (e.g. a DWord read from a location written with MOVDQA) under certain circumstances, for example. The dual case (large load overlapping with smaller stores) is substantially harder though, because it can involved multiple store buffers at the same time, and I currently know of no processor that implements this. And whenever you hit a case where the processor can’t perform store forwarding, you get the “Loads Blocked by Store Forwarding” stall above (effectively, x86′s version of a Load-Hit-Store).

Revenge of the cycle-eaters

Which brings us back to the example at hand: what’s going on in those functions, BinTransformedTrianglesMT in particular? Some investigation of the compiled code shows that the first sign of blocked loads is near these reads:

Gather(xformedPos, index, numLanes);
		
vFxPt4 xFormedFxPtPos[3];
for(int i = 0; i < 3; i++)
{
    xFormedFxPtPos[i].X = ftoi_round(xformedPos[i].X);
    xFormedFxPtPos[i].Y = ftoi_round(xformedPos[i].Y);
    xFormedFxPtPos[i].Z = ftoi_round(xformedPos[i].Z);
    xFormedFxPtPos[i].W = ftoi_round(xformedPos[i].W);
}

and looking at the code for Gather shows us exactly what’s going on:

void TransformedMeshSSE::Gather(vFloat4 pOut[3], UINT triId,
    UINT numLanes)
{
    for(UINT l = 0; l < numLanes; l++)
    {
        for(UINT i = 0; i < 3; i++)
        {
            UINT index = mpIndices[(triId * 3) + (l * 3) + i];
            pOut[i].X.lane[l] = mpXformedPos[index].m128_f32[0];
            pOut[i].Y.lane[l] = mpXformedPos[index].m128_f32[1];
            pOut[i].Z.lane[l] = mpXformedPos[index].m128_f32[2];
            pOut[i].W.lane[l] = mpXformedPos[index].m128_f32[3];
        }
    }
}

Aha! This is the code that transforms our vertices from the AoS (array of structures) form that’s used in memory into the SoA (structure of arrays) form we use during binning (and also the two rasterizers). Note that the output vectors are written element by element; then, as soon as we try to read the whole vector into a register, we hit a forwarding stall, because the core can’t forward the results from the 4 different stores per vector to a single load. It turns out that the other two instances of forwarding stalls run into this problem for the same reason – during the gather of bounding box vertices and triangle vertices in the rasterizer, respectively.

So how do we fix it? Well, we’d really like those vectors to be written using full-width SIMD stores instead. Luckily, that’s not too hard: converting data from AoS to SoA is essentially a matrix transpose, and our typical use case happens to be 4 separate 4-vectors, i.e. a 4×4 matrix; luckily, a 4×4 matrix transpose is fairly easy to do in SSE, and Intel’s intrinsics header file even comes with a macro that implements it. So here’s the updated Gather that uses a SSE transpose:

void TransformedMeshSSE::Gather(vFloat4 pOut[3], UINT triId,
    UINT numLanes)
{
    const UINT *pInd0 = &mpIndices[triId * 3];
    const UINT *pInd1 = pInd0 + (numLanes > 1 ? 3 : 0);
    const UINT *pInd2 = pInd0 + (numLanes > 2 ? 6 : 0);
    const UINT *pInd3 = pInd0 + (numLanes > 3 ? 9 : 0);

    for(UINT i = 0; i < 3; i++)
    {
        __m128 v0 = mpXformedPos[pInd0[i]]; // x0 y0 z0 w0
        __m128 v1 = mpXformedPos[pInd1[i]]; // x1 y1 z1 w1
        __m128 v2 = mpXformedPos[pInd2[i]]; // x2 y2 z2 w2
        __m128 v3 = mpXformedPos[pInd3[i]]; // x3 y3 z3 w3
        _MM_TRANSPOSE4_PS(v0, v1, v2, v3);
        // After transpose:
        pOut[i].X = VecF32(v0); // v0 = x0 x1 x2 x3
        pOut[i].Y = VecF32(v1); // v1 = y0 y1 y2 y3
        pOut[i].Z = VecF32(v2); // v2 = z0 z1 z2 z3
        pOut[i].W = VecF32(v3); // v3 = w0 w1 w2 w3
    }
}

Not much to talk about here. The other two instances of this get modified in the exact same way. So how much does it help?

Change: Gather using SSE instructions and transpose

Total cull time min 25th med 75th max mean sdev
Initial 3.148 3.208 3.243 3.305 4.321 3.271 0.100
SSE Gather 2.934 3.078 3.110 3.156 3.992 3.133 0.103
Render depth min 25th med 75th max mean sdev
Initial 2.206 2.220 2.228 2.242 2.364 2.234 0.022
SSE Gather 2.099 2.119 2.137 2.156 2.242 2.141 0.028
Depth test min 25th med 75th max mean sdev
Initial 0.813 0.830 0.839 0.847 0.886 0.839 0.013
SSE Gather 0.773 0.793 0.802 0.809 0.843 0.801 0.012

So we’re another 0.13ms down, about 0.04ms of which we gain in the depth testing pass and the remaining 0.09ms in the rendering pass. And a re-run with VTune confirms that the blocked loads are indeed gone:

Store forwarding fixed

Vertex transformation

Last time, we modified the vertex transform code in the depth test rasterizer to get rid of the z-clamping and simplify the clipping logic. We also changed the logic to make better use of the regular structure of our input vertices. We don’t have any special structure we can use to make vertex transforms on regular meshes faster, but we definitely can (and should) improve the projection and near-clip logic, turning this:

mpXformedPos[i] = TransformCoords(&mpVertices[i].position,
    cumulativeMatrix);
float oneOverW = 1.0f/max(mpXformedPos[i].m128_f32[3], 0.0000001f);
mpXformedPos[i] = _mm_mul_ps(mpXformedPos[i],
    _mm_set1_ps(oneOverW));
mpXformedPos[i].m128_f32[3] = oneOverW;

into this:

__m128 xform = TransformCoords(&mpVertices[i].position,
    cumulativeMatrix);
__m128 vertZ = _mm_shuffle_ps(xform, xform, 0xaa);
__m128 vertW = _mm_shuffle_ps(xform, xform, 0xff);
__m128 projected = _mm_div_ps(xform, vertW);

// set to all-0 if near-clipped
__m128 mNoNearClip = _mm_cmple_ps(vertZ, vertW);
mpXformedPos[i] = _mm_and_ps(projected, mNoNearClip);

Here, near-clipped vertices are set to the (invalid) x=y=z=w=0, and the binner code can just check for w==0 to test whether a vertex is near-clipped instead of having to use the original w tests (which again had a hardcoded near plane value).

This change doesn’t have any significant impact on the running time, but it does get rid of the hardcoded near plane location for good, so I thought it was worth mentioning.

Again with the memory ordering

And if we profile again, we notice there’s at least one more surprise waiting for us in the binning code:

Binning Machine Clears

Machine clears? We’ve seen them before, way back in “Cores don’t like to share“. And yes, they’re again for memory ordering reasons. What did we do wrong this time? It turns out that the problematic code has been in there since the beginning, and ran just fine for quite a while, but ever since the scheduling optimizations we did in “The care and feeding of worker threads“, we now have binning jobs running tightly packed enough to run into memory ordering issues. So what’s the problem? Here’s the code:

// Add triangle to the tiles or bins that the bounding box covers
int row, col;
for(row = startY; row <= endY; row++)
{
    int offset1 = YOFFSET1_MT * row;
    int offset2 = YOFFSET2_MT * row;
    for(col = startX; col <= endX; col++)
    {
        int idx1 = offset1 + (XOFFSET1_MT * col) + taskId;
        int idx2 = offset2 + (XOFFSET2_MT * col) +
            (taskId * MAX_TRIS_IN_BIN_MT) + pNumTrisInBin[idx1];
        pBin[idx2] = index + i;
        pBinModel[idx2] = modelId;
        pBinMesh[idx2] = meshId;
        pNumTrisInBin[idx1] += 1;
    }
}

The problem turns out to be the array pNumTrisInBin. Even though it’s accessed as 1D, it is effectively a 3D array like this:

uint16 pNumTrisInBin[TILE_ROWS][TILE_COLS][BINNER_TASKS]

The TILE_ROWS and TILE_COLS parts should be obvious. The BINNER_TASKS needs some explanation though: as you hopefully remember, we try to divide the work between binning tasks so that each of them gets roughly the same amount of triangles. Now, before we start binning triangles, we don’t know which tiles they will go into – after all, that’s what the binner is there to find out.

We could have just one output buffer (bin) per tile; but then, whenever two binner tasks simultaneously end up trying to add a triangle to the same tile, they will end up getting serialized because they try to increment the same counter. And even worse, it would mean that the actual order of triangles in the bins would be different between every run, depending on when exactly each thread was running; while not fatal for depth buffers (we just end up storing the max of all triangles rendered to a pixel anyway, which is ordering-invariant) it’s still a complete pain to debug.

Hence there is one bin per tile per binning worker. We already know that the binning workers get assigned the triangles in the order they occur in the models – with the 32 binning workers we use, the first binning task gets the first 1/32 of the triangles, and second binning task gets the second 1/32, and so forth. And each binner processes triangles in order. This means that the rasterizer tasks can still process triangles in the original order they occur in the mesh – first process all triangles inserted by binner 0, then all triangles inserted by binner 1, and so forth. Since they’re in distinct memory ranges, that’s easily done. And each bin has a separate triangle counter, so they don’t interfere, right? Nothing to see here, move along.

Well, except for the bit where coherency is managed on a cache line granularity. Now, as you can see from the above declaration, the triangle counts for all the binner tasks are stored in adjacent 16-bit words; 32 of them, to be precise, one per binner task. So what was the size of a cache line again? 64 bytes, you say?

Oops.

Yep, even though it’s 32 separate counters, for the purposes of the memory subsystem it’s just the same as if it was all a single counter per tile (well, it might be slightly better than that if the initial pointer isn’t 64-byte aligned, but you get the idea).

Luckily for us, the fix is dead easy: all we have to do is shuffle the order of the array indices around.

uint16 pNumTrisInBin[BINNER_TASKS][TILE_ROWS][TILE_COLS]

We also happen to have 32 tiles total – which means that now, each binner task gets its own cache line by itself (again, provided we align things correctly). So again, it’s a really easy fix. The question being – how much does it help?

Change: Change pNumTrisInBin array indexing

Total cull time min 25th med 75th max mean sdev
Initial 3.148 3.208 3.243 3.305 4.321 3.271 0.100
SSE Gather 2.934 3.078 3.110 3.156 3.992 3.133 0.103
Change bin inds 2.842 2.933 2.980 3.042 3.914 3.007 0.125
Render depth min 25th med 75th max mean sdev
Initial 2.206 2.220 2.228 2.242 2.364 2.234 0.022
SSE Gather 2.099 2.119 2.137 2.156 2.242 2.141 0.028
Change bin inds 1.980 2.008 2.026 2.046 2.172 2.032 0.035

That’s right, a 0.1ms difference from changing the memory layout of a 1024-entry, 2048-byte array. You really need to be extremely careful with the layout of shared data when dealing with multiple cores at the same time.

Once more, with branching

At this point, the binner is starting to look fairly good, but there’s one more thing that springs to eye:

Binning branch mispredicts

Branch mispredictions. Now, the two rasterizers have legitimate reason to be mispredicting branches some of the time – they’re processing triangles with fairly unpredictable sizes, and the depth test rasterizer also has an early-out that’s hard to predict. But the binner has less of an excuse – sure, the triangles have very different dimensions measured in 2×2 pixel blocks, but the vast majority of our triangles fits inside one of our (generously sized!) 320×90 pixel tiles. So where are all these branches?

for(int i = 0; i < numLanes; i++)
{
    // Skip triangle if area is zero 
    if(triArea.lane[i] <= 0) continue;
    if(vEndX.lane[i] < vStartX.lane[i] ||
       vEndY.lane[i] < vStartY.lane[i]) continue;
			
    float oneOverW[3];
    for(int j = 0; j < 3; j++)
        oneOverW[j] = xformedPos[j].W.lane[i];
			
    // Reject the triangle if any of its verts are outside the
    // near clip plane
    if(oneOverW[0] == 0.0f || oneOverW[1] == 0.0f ||
        oneOverW[2] == 0.0f) continue;

    // ...
}

Oh yeah, that. In particular, the first test (which checks for degenerate and back-facing triangles) will reject roughly half of all triangles and can be fairly random (as far as the CPU is concerned). Now, last time we had an issue with branch mispredicts, we simply removed the offending early-out. That’s a really bad idea in this case – any triangles we don’t reject here, we’re gonna waste even more work on later. No, these tests really should all be done here.

However, there’s no need for them to be done like this; right now, we have a whole slew of branches that are all over the map. Can’t we consolidate the branches somehow?

Of course we can. The basic idea is to do all the tests on 4 triangles at a time, while we’re still in SIMD form:

// Figure out which lanes are active
VecS32 mFront = cmpgt(triArea, VecS32::zero());
VecS32 mNonemptyX = cmpgt(vEndX, vStartX);
VecS32 mNonemptyY = cmpgt(vEndY, vStartY);
VecF32 mAccept1 = bits2float(mFront & mNonemptyX & mNonemptyY);

// All verts must be inside the near clip volume
VecF32 mW0 = cmpgt(xformedPos[0].W, VecF32::zero());
VecF32 mW1 = cmpgt(xformedPos[1].W, VecF32::zero());
VecF32 mW2 = cmpgt(xformedPos[2].W, VecF32::zero());

VecF32 mAccept = and(and(mAccept1, mW0), and(mW1, mW2));
// laneMask == (1 << numLanes) - 1; - initialized earlier
unsigned int triMask = _mm_movemask_ps(mAccept.simd) & laneMask;

Note I change the “is not near-clipped test” from !(w == 0.0f) to w > 0.0f, on account of me knowing that all legal w’s happen to not just be non-zero, they’re positive (okay, what really happened is that I forgot to add a “cmpne” when I wrote VecF32 and didn’t feel like adding it here). Other than that, it’s fairly straightforward. We build a mask in vector registers, then turn it into an integer mask of active lanes using MOVMSKPS.

With this, we could turn all the original branches into a single test in the i loop:

if((triMask & (1 << i)) == 0)
    continue;

However, we can do slightly better than that: it turns out we can iterate pretty much directly over the set bits in triMask, which means we’re now down to one single branch in the outer loop – the loop counter itself. The modified loop looks like this:

while(triMask)
{
    int i = FindClearLSB(&triMask);
    // ...
}

So what does the magic FindClearLSB function do? It better not contain any branches! But lucky for us, it’s quite straightforward:

// Find index of least-significant set bit in mask
// and clear it (mask must be nonzero)
static int FindClearLSB(unsigned int *mask)
{
    unsigned long idx;
    _BitScanForward(&idx, *mask);
    *mask &= *mask - 1;
    return idx;
}

all it takes is _BitScanForward (the VC++ intrinsic for the x86 BSF instruction) and a really old trick for clearing the least-significant set bit in a value. In other words, this compiles into about 3 integer instructions and is completely branch-free. Good enough. So does it help?

Change: Less branches in binner

Total cull time min 25th med 75th max mean sdev
Initial 3.148 3.208 3.243 3.305 4.321 3.271 0.100
SSE Gather 2.934 3.078 3.110 3.156 3.992 3.133 0.103
Change bin inds 2.842 2.933 2.980 3.042 3.914 3.007 0.125
Less branches 2.786 2.879 2.915 2.969 3.706 2.936 0.092
Render depth min 25th med 75th max mean sdev
Initial 2.206 2.220 2.228 2.242 2.364 2.234 0.022
SSE Gather 2.099 2.119 2.137 2.156 2.242 2.141 0.028
Change bin inds 1.980 2.008 2.026 2.046 2.172 2.032 0.035
Less branches 1.905 1.934 1.946 1.959 2.012 1.947 0.019

That’s another 0.07ms off the total, for about a 10% reduction in median total cull time for this post, and a 12.7% reduction in median rasterizer time. And for our customary victory lap, here’s the VTune results after this change:

Binning with branching improved

The branch mispredictions aren’t gone, but we did make a notable dent. It’s more obvious if you compare the number of clock cyles with the previous image.

And with that, I’ll conclude this journey into both the triangle binner and the dark side of speculative execution. We’re also getting close to the end of this series – the next post will look again at the loading and rendering code we’ve been intentionally ignoring for most of this series :), and after that I’ll finish with a summary and wrap-up – including a list of things I didn’t cover, and why not.


Mopping up

$
0
0

This post is part of a series – go here for the index.

Welcome back! This post is going to be slightly different from the others. So far, I’ve attempted to group the material thematically, so that each post has a coherent theme (to a first-order approximation, anyway). Well, this one doesn’t – this is a collection of everything that didn’t fit anywhere else. But don’t worry, there’s still some good stuff in here! That said, one warning: there’s a bunch of poking around in the framework code this time, and it didn’t come with docs, so I’m honestly not quite sure how some of the internals are supposed to work. So the code changes referenced this time are definitely on the hacky side of things.

The elephant in the room

Featured quite near the top of all the profiles we’ve seen so far are two functions I haven’t talked about before:

Rendering hot spots

In case you’re wondering, the VIDMM_Global::ReferenceDmaBuffer is what used to be just “[dxgmms1.sys]” in the previous posts; I’ve set up VTune to use the symbol server to get debug symbols for this DLL. Now, I haven’t talked about this code before because it’s part of the GPU rendering, not the software rasterizer, but let’s broaden our scope one final time.

What you can see here is the video memory manager going over the list of resources (vertex/index buffers, constant buffers, textures, and so forth) referenced by a DMA buffer (which is what WDDM calls GPU command buffers in the native format) and completely blowing out the cache; each resource has some amount of associated metadata that the memory manager needs to look at (and possibly update), and it turns out there’s many of them. The cache is not amused.

So, what can we do to use less resources? There’s lots of options, but one thing I had noticed while measuring loading time is that there’s one dynamic constant buffer per model:

// Create the model constant buffer.
HRESULT hr;
D3D11_BUFFER_DESC bd = {0};
bd.ByteWidth = sizeof(CPUTModelConstantBuffer);
bd.BindFlags = D3D11_BIND_CONSTANT_BUFFER;
bd.Usage = D3D11_USAGE_DYNAMIC;
bd.CPUAccessFlags = D3D11_CPU_ACCESS_WRITE;
hr = (CPUT_DX11::GetDevice())->CreateBuffer( &bd, NULL,
    &mpModelConstantBuffer );
ASSERT( !FAILED( hr ), _L("Error creating constant buffer.") );

Note that they’re all the same size, and it turns out that all of them get updated (using a Map with DISCARD) immediately before they get used for rendering. And because there’s about 27000 models in this example, we’re talking about a lot of constant buffers here.

What if we instead just created one dynamic model constant buffer, and shared it between all the models? It’s a fairly simple change to make, if you’re willing to do it in a hacky fashion (as said, not very clean code this time). For this test, I took the liberty of adding some timing around the actual D3D rendering code as well, so we can compare. It’s probably gonna make a difference, but how much can it be, really?

Change: Single shared dynamic model constant buffer

Render scene min 25th med 75th max mean sdev
Original 3.392 3.501 3.551 3.618 4.155 3.586 0.137
One dynamic CB 2.474 2.562 2.600 2.644 3.043 2.609 0.068

It turns out that reducing the number of distinct constant buffers referenced per frame by several thousand is a pretty big deal. Drivers work hard to make constant buffer DISCARD really, really fast, and they make sure that the underlying allocations get handled quickly. And discarding a single constant buffer a thousand times in a frame works out to be a lot faster than discarding a thousand constant buffers once each.

Lesson learned: for “throwaway” constant buffers, it’s a good idea to design your renderer so it only allocates one underlying D3D constant buffer per size class. More are not necessary and can (evidently) induce a substantial amount of overhead. D3D11.1 adds a few features that allow you to further reduce that count down to a single constant buffer that’s used the same way that dynamic vertex/index buffers are; as you can see, there’s a reason. Here’s the profile after this single fix:

Render after dynamic CB fix

Still a lot of time spent in the driver and the video memory manager, but if you compare the raw cycle counts with the previous image, you can see that this change really made quite a dent.

Loading time

This was (for the most part) something I worked on just to make my life easier – as you can imagine, while writing this series, I’ve recorded lots of profiling and tests runs, and the loading time is a fixed cost I pay every time. I won’t go in depth here, but I still want to give a brief summary of the changes I made and why. If you want to follow along, the changes in the source code start at the “Track loading time” commit.

Initial: 9.29s

First, I simply added a timer and code to print the loading time to the debug output window.

Load materials once, not once per model: 4.54s

One thing I noticed way back in January when I did my initial testing was that most materials seem to get loaded multiple times; there seems to be logic in the asset library code to avoid loading materials multiple times, but it didn’t appear to work for me. So I modified the code to actually load each material only once and then create copies when requested. As you can see, this change by itself roughly cut loading times in half.

FindAsset optimizations: 4.32s

FindAsset is the function used in the asset manager to actually look up resources by name. With two simples changes to avoid unnecessary path name resolution and string compares, the loading time loses another 200ms.

Better config file loading: 2.54s

I mentioned this in “A string processing rant“, but didn’t actually merge the changes into the blog branch so far. Well, here you go: with these three commits that together rewrite a substantial portion of the config file reading, we lose almost another 2 seconds. Yes, that was 2 whole seconds worth of unnecessary allocations and horribly inefficient string handling. I wrote that rant for a reason.

Improve shader input layout cache: 2.03s

D3D11 wants shader input layouts to be created with a pointer to the bytecode of the shader it’s going to be used with, to handle vertex format to shader binding. The “shader input layout cache” is just an internal cache to produce such input layouts for all unique combinations of vertex formats and shaders we use. The original implementation of this cache was fairly inefficient, but the code already contained a “TODO” comment with instructions of how to fix it. In this commit, I implemented that fix.

Reduce temporary strings: 1.88s

There were still a bunch of unnecessary string temporaries being created, which I found simply by looking at the call stack profiles of free calls during the loading phase (yet another useful application for profilers)! Two commits later, this problem was resolved too.

Actually share materials: 1.46s

Finally, this commit goes one step further than just loading the materials once, it also actually shares the same material instance between all its users (the previous version created copies). This is not necessarily a safe change to make. I have no idea what invariants the asset manager tries to enforce, if any. Certainly, this would cause problems if someone were to start modifying materials after loading – you’d need to introduce copy-on-write or something similar. But in our case (i.e. the Software Occlusion Culling demo), the materials do not get modified after loading, and sharing them is completely safe.

Not only does this reduce loading time by another 400ms, it also makes rendering a lot faster, because suddenly there’s a lot less cache misses when setting up shaders and render states for the individual models:

Change: Share materials.

Render scene min 25th med 75th max mean sdev
Original 3.392 3.501 3.551 3.618 4.155 3.586 0.137
One dynamic CB 2.474 2.562 2.600 2.644 3.043 2.609 0.068
Share materials 1.870 1.922 1.938 1.964 2.331 1.954 0.057

Again, this is somewhat extreme because there’s so many different models around, but it illustrates the point: you really want to make sure there’s no unnecessary duplication of data used during rendering; you’re going to be missing the cache enough during regular rendering as it is.

And at that point, I decided that I could live with 1.5 seconds of loading time, so I didn’t pursue the matter any further. :)

The final rendering tweak

There’s one more function with a high number of cache misses in the profiles I’ve been running, even though it’s never been at the top. That function is AABBoxRasterizerSSE::RenderVisible, which uses the (post-occlusion-test) visibility information to render all visible models. Here’s the code:

void AABBoxRasterizerSSE::RenderVisible(CPUTAssetSet **pAssetSet,
    CPUTRenderParametersDX &renderParams,
    UINT numAssetSets)
{
    int count = 0;

    for(UINT assetId = 0, modelId = 0; assetId < numAssetSets; assetId++)
    {
        for(UINT nodeId = 0; nodeId < GetAssetCount(); nodeId++)
        {
            CPUTRenderNode* pRenderNode = NULL;
            CPUTResult result = pAssetSet[assetId]->GetAssetByIndex(nodeId, &pRenderNode);
            ASSERT((CPUT_SUCCESS == result), _L ("Failed getting asset by index")); 
            if(pRenderNode->IsModel())
            {
                if(mpVisible[modelId])
                {
                    CPUTModelDX11* model = (CPUTModelDX11*)pRenderNode;
                    model = (CPUTModelDX11*)pRenderNode;
                    model->Render(renderParams);
                    count++;
                }
                modelId++;			
            }
            pRenderNode->Release();
        }
    }
    mNumCulled =  mNumModels - count;
}

This code first enumerates all RenderNodes (a base class) in the active asset libraries, ask each of them “are you a model?”, and if so renders it. This is a construct that I’ve seen several times before – but from a performance standpoint, this is a terrible idea. We walk over the whole scene database, do a virtual function call (which means we have, at the very least, load the cache line containing the vtable pointer) to check if the current item is a model, and only then check if it is culled – in which case we just ignore it.

That is a stupid game and we should stop playing it.

Luckily, it’s easy to fix: at load time, we traverse the scene database once, to make a list of all the models. Note the code already does such a pass to initialize the bounding boxes etc. for the occlusion culling pass; all we have to do is set an extra array that maps modelIds to the corresponding models. Then the actual rendering code turns into:

void AABBoxRasterizerSSE::RenderVisible(CPUTAssetSet **pAssetSet,
    CPUTRenderParametersDX &renderParams,
    UINT numAssetSets)
{
    int count = 0;

    for(modelId = 0; modelId < mNumModels; modelId++)
    {
        if(mpVisible[modelId])
        {
            mpModels[modelId]->Render(renderParams);
            count++;
        }
    }

    mNumCulled =  mNumModels - count;
}

That already looks much better. But how much does it help?

Change: Cull before accessing models

Render scene min 25th med 75th max mean sdev
Original 3.392 3.501 3.551 3.618 4.155 3.586 0.137
One dynamic CB 2.474 2.562 2.600 2.644 3.043 2.609 0.068
Share materials 1.870 1.922 1.938 1.964 2.331 1.954 0.057
Fix RenderVisible 1.321 1.358 1.371 1.406 1.731 1.388 0.047

I rest my case.

And I figure that this nice 2.59x cumulative speedup on the rendering code is a good stopping point for the coding part of this series – quit while you’re ahead and all that. There’s a few more minor fixes (both for actual bugs and speed problems) on Github, but it’s all fairly small change, so I won’t go into the details.

This series is not yet over, though; we’ve covered a lot of ground, and every case study should spend some time reflecting on the lessons learned. I also want to explain why I covered what I did, what I left out, and a few notes on the way I tend to approach performance problems. So all that will be in the next and final post of this series. Until then!


Optimizing Software Occlusion Culling: The Reckoning

$
0
0

This post is part of a series – go here for the index.

Welcome back! Last time, I promised to end the series with a bit of reflection on the results. So, time to find out how far we’ve come!

The results

Without further ado, here’s the breakdown of per-frame work at the end of the respective posts (names abbreviated), in order:

Post Cull / setup Render depth Depth test Render scene Total
Initial 1.988 3.410 2.091 5.567 13.056
Write Combining 1.946 3.407 2.058 3.497 10.908
Sharing 1.420 3.432 1.829 3.490 10.171
Cache issues 1.045 3.485 1.980 3.420 9.930
Frustum culling 0.735 3.424 1.812 3.495 9.466
Depth buffers 1 0.740 3.061 1.791 3.434 9.026
Depth buffers 2 0.739 2.755 1.484 3.578 8.556
Workers 1 0.418 2.134 1.354 3.553 7.459
Workers 2 0.197 2.217 1.191 3.463 7.068
Dataflows 0.180 2.224 0.831 3.589 6.824
Speculation 0.169 1.972 0.766 3.655 6.562
Mopping up 0.183 1.940 0.797 1.389 4.309
Total diff. -90.0% -43.1% -61.9% -75.0% -67.0%
Speedup 10.86x 1.76x 2.62x 4.01x 3.03x

What, you think that doesn’t tell you much? Okay, so did I. Have a graph instead:

Time breakdown over posts

The image is a link to the full-size version that you probably want to look at. Note that in both the table and the image, updating the depth test pass to use the rasterizer improvements is chalked up to “Depth buffers done quick, part 2″, not “The care and feeding of worker threads, part 1″ where I mentioned it in the text.

From the graph, you should clearly see one very interesting fact: the two biggest individual improvements – the write combining fix at 2.1ms and “Mopping up” at 2.2ms – both affect the D3D rendering code, and don’t have anything to do with the software occlusion culling code. In fact, it wasn’t until “Depth buffers done quick” that we actually started working on that part of the code. Which makes you wonder…

What-if machine

Is the software occlusion culling actually worth it? That is, how much do we actually get for the CPU time we invest in occlusion culling? To help answer this, I ran a few more tests:

Test Cull / setup Render depth Depth test Render scene Total
Initial 1.988 3.410 2.091 5.567 13.056
Initial, no occ. 1.433 0.000 0.000 25.184 26.617
Cherry-pick 1.548 3.462 1.977 2.084 9.071
Cherry-pick, no occ. 1.360 0.000 0.000 10.124 11.243
Final 0.183 1.940 0.797 1.389 4.309
Final, no occ. 0.138 0.000 0.000 6.866 7.004

Yes, the occlusion culling was a solid win both before and after. But the interesting value is the “cherry-pick” one. This is the original code, with only the following changes applied: (okay, and also with the timekeeping code added, in case you feel like nitpicking)

In other words, “Cherry-pick” is within a few dozen lines of the original code, all of the changes are to “framework” code not the actual sample, and none of them do anything fancy. Yet it makes the difference between occlusion culling enabled and disabled shrink to about a 1.24x speedup, down from the 2x it was before!

A brief digression

This kind of thing is, in a nutshell, the reason why graphics papers really need to come with source code. Anything GPU-related in particular is full of performance cliffs like this. In this case, I had the source code, so I could investigate what was going on, fix a few problems, and get a much more realistic assessment of the gain to expect from this kind of technique. Had it just been a paper claiming a “2x improvement”, I would certainly not have been able to reproduce that result – note that in the “final” version, the speedup goes back to about 1.63x, but that’s with a considerable amount of extra work.

I mention this because it’s a very common problem: whatever technique the author of a paper is proposing is well-optimized and tweaked to look good, whereas the things that it’s being compared with are often a very sloppy implementation. The end result is lots of papers that claim “substantial gains” over the prior state of the art that somehow never materialize for anyone else. At one extreme, I’ve had one of my professors state outright at one point that he just stopped giving out source code to their algorithms because the effort invested in getting other people to successfully replicate his old results “distracted” him from producing new ones. (I’m not going to name names here, but he later stated a several other things along the same lines, and he’s probably the number one reason for me deciding against pursuing a career in academia.)

To that kind of attitude, I have only one thing to say: If you care only about producing results and not independent verification, then you may be brilliant, but you are not a scientist, and there’s a very good chance that your life’s work is useless to anyone but yourself.

Conversely, exposing your code to outside eyes might not be the optimal way to stroke your ego in case somebody finds an obvious mistake :), but it sure makes your approach a lot more likely to actually become relevant in practice. Anyway, let’s get back to the subject at hand.

Observations

The number one lesson from all of this probably is that there’s lots of ways to shoot yourself in the foot in graphics, and that it’s really easy to do so without even noticing it. So don’t assume, profile. I’ve used a fancy profiler with event-based sampling (VTune), but even a simple tool like Sleepy will tell you when a small piece of code takes a disproportionate amount of time. You just have to be on the lookout for these things.

Which brings me to the next point: you should always have an expectation of how long things should take. A common misconception is that profilers are primarily useful to identify the hot spots in an application, so you can focus your efforts there. Let’s have another look at the very first profiler screenshot I posted in this series:

Reading from write-combined memory

If I had gone purely by what takes the largest amount of time, I’d have started with the depth buffer rasterization pass; as you should well recall, it took me several posts to explain what’s even going on in that code, and as you can see from the chart above, while we got a good win out of improving it (about 1.1ms total), doing so took lots of individual changes. Compare with what I actually worked on first – namely, the Write Combining issue, which gave us a 2.1ms win for a three-line change.

So what’s the secret? Don’t use a profile exclusively to look for hot spots. In particular, if your profile has the hot spots you expected (like the depth buffer rasterizer in this example), they’re not worth more than a quick check to see if there’s any obvious waste going on. What you really want to look for are anomalies: code that seems to be running into execution issues (like SetRenderStates with the read-back from write-combined memory running at over 9 cycles per instruction), or things that just shouldn’t take as much time as they seem to (like the frustum culling code we looked at for the next few posts). If used correctly, a profiler is a powerful tool not just for performance tuning, but also to find deeper underlying architectural issues.

While you’re at it…

Anyway, once you’ve picked a suitable target, I recommend that you do not just the necessary work to knock it out of the top 10 (or some other arbitrary cut-off). After “Frustum culling: turning the crank“, a commenter asked why I would spend the extra time optimizing a function that was, at the time, only at the #10 spot in the profile. A perfectly valid question, but one I have three separate answers to:

First, the answer I gave in the comments at the time: code is not just isolated from everything else; it exists in a context. A lot of the time in optimizing code (or even just reading it, for that matter) is spent building up a mental model of what’s going on and how it relates to the rest of the system. The best time to make changes to code is while that mental model is still current; if you drop the topic and work somewhere else for a bit, you’ll have to redo at least part of that work again. So if you have ideas for further improvements while you’re working on code, that’s a good time to try them out (once you’ve finished your current task, anyway). If you run out of ideas, or if you notice you’re starting to micro-optimize where you really shouldn’t, then stop. But by all means continue while the going is good; even if you don’t need that code to be faster now, you might want it later.

Second, never mind the relative position. As you can see in the table above, the “advanced” frustum culling changes reduced the total frame time by about 0.4ms. That’s about as much as we got out of our first set of depth buffer rendering changes, even though it was much simpler work. Particularly for games, where you usually have a set frame rate target, you don’t particularly care where exactly you get the gains from; 0.3ms less is 0.3ms less, no matter whether it’s done by speeding up one of the Top 10 functions slightly or something else substantially!

Third, relating to my comment about looking for anomalies above: unless there’s a really stupid mistake somewhere, it’s fairly likely that the top 10, or top 20, or top whatever hot spots are actually code that does substantial work – certainly so for code that other people have already optimized. However, most people do tend to work on the hot spots first when looking to improve performance. My favorite sport when optimizing code is starting in the middle ranks: while everyone else is off banging their head against the hard problems, I will casually snipe at functions in the 0.05%-1.0% total run time range. This has two advantages: first, you can often get rid of a lot of these functions entirely. Even if it’s only 0.2% of your total time, if you manage to get rid of it, that’s 0.2% that are gone. It’s usually a lot easier to get rid of a 0.2% function than it is to squeeze an extra 2% out of a 10%-run time function that 10 people have already looked at. And second, the top hot spots are usually in leafy code. But down in the middle ranks is “middle management” – code that’s just passing data around, maybe with some minor reformatting. That’s your entry point to re-designing data flows: this is the code where subsystems meet – the place where restructuring will make a difference. When optimizing interfaces, it’s crucial to be working on the interfaces that actually have problems, and this is how you find them.

Ground we’ve covered

Throughout this series, my emphasis has been on changes that are fairly high-yield but have low impact in terms of how much disruption they cause. I also made no substantial algorithmic changes. That was fully intentional, but it might be surprising; after all, as any (good) text covering optimization will tell you, it’s much more important to get your algorithms right than it is to fine-tune your code. So why this bias?

Again, I did this for a reason: while algorithmic changes are indeed the ticket when you need large speed-ups, they’re also very context-sensitive. For example, instead of optimizing the frustum culling code the way I did – by making the code more SIMD- and cache-friendly – I could have just switched to a bounding volume hierarchy instead. And normally, I probably would have. But there’s plenty of material on bounding volume hierarchies out there, and I trust you to be able to find it yourself; by now, there’s also a good amount of Google-able material on “Data-oriented Design” (I dislike the term; much like “Object-oriented Design”, it means everything and nothing) and designing algorithms and data structures from scratch for good SIMD and cache efficiency.

But I found that there’s a distinct lack of material for the actual problem most of us actually face when optimizing: how do I make existing code faster without breaking it or rewriting it from scratch? So my point with this series is that there’s a lot you can accomplish purely using fairly local and incremental changes. And while the actual changes are specific to the code, the underlying ideas are very much universal, or at least I hope so. And I couldn’t resist throwing in some low-level architectural material too, which I hope will come in handy. :)

Changes I intentionally did not make

So finally, here’s a list of things I did not discuss in this series, because they were either too invasive, too tricky or changed the algorithms substantially:

  • Changing the way the binner works. We don’t need that much information per triangle, and currently we gather vertices both in the binner and the rasterizer, which is a fairly expensive step. I did implement a variant that writes out signed 16-bit coordinates and the set-up Z plane equation; it saves roughly another 0.1ms in the final rasterizer, but it’s a fairly invasive change. Code is here for those who are interested. (I may end up posting other stuff to that branch later, hence the name).
  • A hierarchical rasterizer for the larger triangles. Another thing I implemented (note this branch is based off a pre-blog version of the codebase) but did not feel like writing about because it took a lot of effort to deliver, ultimately, fairly little gain.
  • Other rasterizer techniques or tweaks. I could have implemented a scanline rasterizer, or a different traversal strategy, or a dozen other things. I chose not to; I wanted to write an introduction to edge-function rasterizers, since they’re cool, simple to understand and less well-known than they should be, and this series gave me a good excuse. I did not, however, want to spend more time on actual rasterizer optimization than the two posts I wrote; it’s easy to spend years of your life on that kind of stuff (I’ve seen it happen!), but there’s a point to be made that this series was already too long, and I did not want to stretch it even further.
  • Directly rasterizing quads in the depth test rasterizer. The depth test rasterizer only handles boxes, which are built from 6 quads. It’s possible to build an edge function rasterizer that directly traverses quads instead of triangles. Again, I wrote the code (not on Github this time) but decided against writing about it; while the basic idea is fairly simple, it turned out to be really ugly to make it work in a “drop-in” fashion with the rest of the code. See this comment and my reply for a few extra details.
  • Ray-trace the boxes in the test pass instead of rasterizing them. Another suggestion by Doug. It’s a cool idea and I think it has potential, but I didn’t try it.
  • Render a lower-res depth buffer using very low-poly, conservative models. This is how I’d actually use this technique for a game; I think bothering with a full-size depth buffer is just a waste of memory bandwidth and processing time, and we do spend a fair amount of our total time just transforming vertices too. Nor is there a big advantage to using the more detailed models for culling. That said, changing this would have required dedicated art for the low-poly occluders (which I didn’t want to do); it also would’ve violated my “no-big-changes” rule for this series. Both these changes are definitely worth looking into if you want to ship this in a game.
  • Try other occlusion culling techniques. Out of the (already considerably bloated) scope of this series.

And that’s it! I hope you had as much fun reading these posts as I did writing them. But for now, it’s back to your regularly scheduled, piece-meal blog fare, at least for the time being! Should I feel the urge to write another novella-sized series of posts again in the near future, I’ll be sure to let you all know by the point I’m, oh, nine posts in or so.


64-bit mode and 3-operand instructions

$
0
0

One interesting thing about x86 is that it’s changed two major architectural “magic values” in the past 10 years. The first is the addition of 64-bit mode, which not only widens all general-purpose registers and gives a much larger virtual address space, it also increases the number of general-purpose and XMM registers from 8 to 16. The second is AVX, which allows all SSE (and other SIMD) instructions to be encoded using non-destructive 3-operand forms instead of the original 2-operand forms.

Since modern x86 processors are trying really hard to run both 32- and 64-bit code well (and same for SSE vs. AVX), this gives us an opportunity to compare the relative performance of these choices in a reasonably level playing field, when running the same (C++) code. Of course, this is nowhere near a perfect comparison, especially since switching from 32 to 64 bits also changes the sizes of pointers and (at the very least) the code generator used by the compiler, but it’s still interesting to be able to do the experiment on a single machine with no fuss. So, without further ado, here’s a quick comparison using the Software Occlusion Culling demo I’ve been writing about for the past month – a fairly SIMD-heavy workload.

Version Occlusion cull Render scene
x86 (baseline) 2.88ms 1.39ms
x86, /arch:SSE2 2.88ms (+0.2%) 1.48ms (+5.8%)
x86, /arch:AVX 2.77ms (-3.8%) 1.43ms (+2.7%)
x64 2.71ms (-5.7%) 1.29ms (-7.2%)
x64, /arch:AVX 2.63ms (-8.7%) 1.28ms (-8.5%)

Note that /arch:AVX makes VC++ use AVX forms of SSE vector instructions (i.e. 3-operand), but it’s all still 4-wide SIMD, not the new 8-wide SIMD floating point. Getting that would require changes to the code. And of course the code uses SSE2 (and, in fact, even SSE4.1) instructions whether we turn on /arch:SSE2 on x86 or not – this only affects how “regular” floating-point code is generated. Also, the speedup percentages are computed from the full-precision values, not the truncated values I put in the table. (Which doesn’t mean much, since I truncated the values to about their level of accuracy)

So what does this tell us? Hard to be sure. It’s very few data points and I haven’t done any work to eliminate the effect of e.g. memory layout / code placement, which can be very much significant. And of course I’ve also changed the compiler. That said, a few observations:

  • Not much of a win turning on /arch:SSE2 on the regular x86 code. If anything, the rendering part of the code gets worse from the “enhanced instruction set” usage. I did not investigate further.
  • The 3-operand AVX instructions provide a solid win of a few percentage points in both 32-bit and 64-bit mode. Considering I’m not using any 8-wide instructions, this is almost exclusively the impact of having less register-register move instructions.
  • Yes, going to 64 bits does make a noticeable difference. Note in particular the dip in rendering time. Whether it’s due to the overhead of 32-bit thunks on a 64-bit system, better code generation on the app side, better code on the D3D runtime/driver side, or most likely a combination of all these factors, the D3D rendering code sure gets a lot faster. And similarly, the SIMD-heavy occlusion cull code sees a good speed-up too. I have not investigated whether this is primarily due to the extra registers, or due to code generation improvements.

I don’t think there’s any particular lesson here, but it’s definitely interesting.


SIMD transposes 1

$
0
0

This one tends to show up fairly frequently in SIMD code: Matrix transposes of one sort or another. The canonical application is transforming data from AoS (array of structures) to the more SIMD-friendly SoA (structure of arrays) format: For concreteness, say we have 4 float vertex positions in 4-wide SIMD registers

  p0 = { x0, y0, z0, w0 }
  p1 = { x1, y1, z1, w1 }
  p2 = { x2, y2, z2, w2 }
  p3 = { x3, y3, z3, w3 }

and would really like them in transposed order instead:

  X = { x0, x1, x2, x3 }
  Y = { y0, y1, y2, y3 }
  Z = { z0, z1, z2, z3 }
  W = { w0, w1, w2, w3 }

Note that here and in the following, I’m writing SIMD 4-vectors as arrays of 4 elements here – none of this nonsense that some authors tend to do where they write vectors as “w, z, y, x” on Little Endian platforms. Endianness is a concept that makes sense for numbers and no sense at all for arrays, which SIMD vectors are, but that’s a rant for another day, so just be advised that I’m always writing things in the order that they’re stored in memory.

Anyway, transposing vectors like this is one application, and the one I’m gonna stick with for the moment because it “only” requires 4×4 values, which are the smallest “interesting” size in a certain sense. Keep in mind there are other applications though. For example, when implementing 2D separable filters, the “vertical” direction (filtering between rows) is usually easy, whereas “horizontal” (filtering between columns within the same register) is trickier – to the point that it’s often faster to transpose, perform a vertical filter, and then transpose back. Anyway, let’s not worry about applications right now, just trust me that it tends to come up more frequently than you might expect. So how do we do this?

One way to do it

The method I see most often is to try and group increasingly larger parts of the result together. For example, we’d like to get “x0″ and “x1″ adjacent to each other, and the same with “x2″ and “x3″, “y0″ and “y1″ and so forth. The canonical way to do this is using the “unpack” (x86), “merge” (PowerPC) or “unzip” (ARM NEON) intrinsics. So to bring “x0″ and “x1″ together in the right order, we would do:

  a0 = interleave32_lft(p0, p1) = { x0, x1, y0, y1 }

where interleave32_lft (“interleave 32-bit words, left half”) corresponds to UNPCKLPS (x86, floats), PUNPCKLDQ (x86, ints), or vmrghw (PowerPC). And to be symmetric, we do the same thing with the other half, giving us:

  a0 = interleave32_lft(p0, p1) = { x0, x1, y0, y1 }
  a1 = interleave32_rgt(p0, p1) = { z0, z1, w0, w1 }

where interleave32_rgt corresponds to UNPCKHPS (x86, floats), PUNPCKHDQ (x86, ints), or vmrglw (PowerPC). The reason I haven’t mentioned the individual opcodes for NEON is that their “unzips” always work on pairs of registers and handle both the “left” and “right” halves at once, forming a combined

  (a0, a1) = interleave32(p0, p1)

operation (VUZP.32) that also happens to be a good way to thing about the whole operation on other architectures – even though it is not the ideal way to perform transposes on NEON, but I’m getting ahead of myself here. Anyway, again by symmetry we then do the same process with the other two rows, yielding:

  // (a0, a1) = interleave32(p0, p1)
  // (a2, a3) = interleave32(p2, p3)
  a0 = interleave32_lft(p0, p1) = { x0, x1, y0, y1 }
  a1 = interleave32_rgt(p0, p1) = { z0, z1, w0, w1 }
  a2 = interleave32_lft(p2, p3) = { x2, x3, y2, y3 }
  a3 = interleave32_rgt(p2, p3) = { z2, z3, w2, w3 }

And presto, we now have all even-odd pairs nicely lined up. Now we can build X by combining the left halves from a0 and a2. Their respective right halves also combine into Y. So we do a similar process like before, only this time we’re working on groups that are pairs of 32-bit values – in other words, we’re really dealing with 64-bit groups:

  // (X, Y) = interleave64(a0, a2)
  // (Z, W) = interleave64(a1, a3)
  X = interleave64_lft(a0, a2) = { x0, x1, x2, x3 }
  Y = interleave64_rgt(a0, a2) = { y0, y1, y2, y3 }
  Z = interleave64_lft(a1, a3) = { z0, z1, z2, z3 }
  W = interleave64_rgt(a1, a3) = { w0, w1, w2, w3 }

This time, interleave64_lft (interleave64_rgt) correspond to MOVLHPS (MOVHLPS) for floats on x86, PUNPCKLQDQ (PUNPCKHQDQ) for ints on x86, or VSWP of d registers on ARM NEON. PowerPCs have no dedicated instruction for this but can synthesize it using vperm. The variety here is why I use my own naming scheme in this article, by the way.

Anyway, that’s one way to do it with interleaves. There’s more than one, however!

Interleaves, variant 2

What if, instead of interleaving p0 with p1, we pair it with p2 instead? By process of elimination, that means we have to pair p1 with p3. Where does that lead us? Let’s find out!

  // (b0, b2) = interleave32(p0, p2)
  // (b1, b3) = interleave32(p1, p3)
  b0 = interleave32_lft(p0, p2) = { x0, x2, y0, y2 }
  b1 = interleave32_lft(p1, p3) = { x1, x3, y1, y3 }
  b2 = interleave32_rgt(p0, p2) = { z0, z2, w0, w2 }
  b3 = interleave32_rgt(p1, p3) = { z1, z3, w1, w3 }

Can you see it? We have four nice little squares in each of the quadrants now, and are in fact just one more set of interleaves away from our desired result:

  // (X, Y) = interleave32(b0, b1)
  // (Z, W) = interleave32(b2, b3)
  X = interleave32_lft(b0, b1) = { x0, x1, x2, x3 }
  Y = interleave32_rgt(b0, b1) = { y0, y1, y2, y3 }
  Z = interleave32_lft(b2, b3) = { z0, z1, z2, z3 }
  W = interleave32_rgt(b2, b3) = { w0, w1, w2, w3 }

This one uses just one type of interleave instruction, which is preferable if you the 64-bit interleaves don’t exist on your target platform (PowerPC) or would require loading a different permutation vector (SPUs, which have to do the whole thing using shufb).

Okay, both of these methods start with a 32-bit interleave. What if we were to start with a 64-bit interleave instead?

It gets a bit weird

Well, let’s just plunge ahead and start by 64-bit interleaving p0 and p1, then see whether it leads anywhere.

  // (c0, c1) = interleave64(p0, p1)
  // (c2, c3) = interleave64(p2, p3)
  c0 = interleave64_lft(p0, p1) = { x0, y0, x1, y1 }
  c1 = interleave64_rgt(p0, p1) = { z0, w0, z1, w1 }
  c2 = interleave64_lft(p2, p3) = { x2, y2, x3, y3 }
  c3 = interleave64_rgt(p2, p3) = { z2, w2, z3, w3 }

Okay. For this one, we can’t continue with our regular interleaves, but we still have the property that each of our target vectors (X, Y, Z, and W) can be built using elements from only two of the c’s. In fact, the low half of each target vector comes from one c and the high half from another, which means that on x86, we can combine the two using SHUFPS. On PPC, there’s always vperm, SPUs have shufb, and NEON has VTBL, all of which are much more general, so again, it can be done there as well:

  // 4 SHUFPS on x86
  X = { c0[0], c0[2], c2[0], c2[2] } = { x0, x1, x2, x3 }
  Y = { c0[1], co[3], c2[1], c2[3] } = { y0, y1, y2, y3 }
  Z = { c1[0], z1[2], c3[0], c3[2] } = { z0, z1, z2, z3 }
  W = { c1[1], c1[3], c3[1], c3[3] } = { w0, w1, w3, w3 }

As said, this one is a bit weird, but it’s the method used for _MM_TRANSPOSE4_PS in Microsoft’s version of Intel’s emmintrin.h (SSE intrinsics header) to this day, and used to be the standard implementation in GCC’s version as well until it got replaced with the first method I discussed.

Anyway, that was starting by 64-bit interleaving p0 and p1. Can we get it if we interleave with p2 too?

The plot thickens

Again, let’s just try it!

  // (c0, c2) = interleave64(p0, p2)
  // (c1, c3) = interleave64(p1, p3)
  c0 = interleave64_lft(p0, p2) = { x0, y0, x2, y2 }
  c1 = interleave64_lft(p1, p3) = { x1, y1, x3, y3 }
  c2 = interleave64_rgt(p0, p2) = { z0, w0, z2, w2 }
  c3 = interleave64_rgt(p1, p3) = { z1, w1, z3, w3 }

Huh. This one leaves the top left and bottom right 2×2 blocks alone and swaps the other two. But we still got closer to our goal – if we swap the top right and bottom left element in each of the four 2×2 blocks, we have a full transpose as well. And NEON happens to have an instruction for that (VTRN.32). As usual, the other platforms can try to emulate this using more general shuffles:

  // 2 VTRN.32 on NEON:
  // (X, Y) = vtrn.32(c0, c1)
  // (Z, W) = vtrn.32(c2, c3)
  X = { c0[0], c1[0], c0[2], c1[2] } = { x0, x1, x2, x3 }
  Y = { c0[1], c1[1], c0[3], c1[3] } = { y0, y1, y2, y3 }
  Z = { c2[0], c3[0], c2[2], c3[2] } = { z0, z1, z2, z3 }
  W = { c2[1], c3[1], c2[3], c3[3] } = { w0, w1, w2, w3 }

Just like NEON’s “unzip” instructions, VTRN both reads and writes two registers, so it is in essence doing the work of two instructions on the other architectures. Which means that we now have 4 different methods to do the same thing that are essentially the same cost in terms of computational complexity. Sure, some methods end up faster than others on different architectures due to various implementation choices, but really, in essence none of these are fundamentally more difficult (or easier) than the others.

Nor are these the only ones – for the last variant, we started by swapping the 2×2 blocks within the 4×4 matrix and then transposing the individual 2×2 blocks, but doing it the other way round works just as well (and is again the same cost). In fact, this generalizes to arbitrary power-of-two sized square matrices – you can just partition it into differently sized block transposes which can run in any order. This even works with rectangular matrices, with some restrictions. (A standard way to perform “chunky to planar” conversion for old bit plane-based graphics architectures uses this general approach to good effect).

And now?

Okay, so far, we have a menagerie of different matrix transpose techniques, all of which essentially have the same complexity. If you’re interested in SIMD coding, I suppose you can just use this as a reference. However, that’s not the actual reason I’m writing this; the real reason is that the whole “why are these things all essentially the same complexity” thing intrigued me, so a while back I looked into this and found out a whole bunch of cool properties that are probably not useful for coding at all, but which I nevertheless found interesting. In other words, I’ll write a few more posts on this topic, which I will spend gleefully nerding out with no particular goal whatsoever. If you don’t care, just stop reading now. You’re welcome!


Texture uploads on Android

$
0
0

RAD Game Tools, my employer, recently (version 2.2e) started shipping Bink 2.2 on Android, and we decided it was time to go over the example texture upload code in our SDK and see if there was any changes we should make – the original code was written years ago. So far, the answer seems to be “no”: what we’re doing seems to be about as good as we can expect when sticking to “mainstream” GL ES, reasonably widely-deployed extensions and the parts of Android officially exposed in the NDK. That said, I have done a bunch of performance measurements over the past few days, and they paint an interesting (if somewhat depressing) picture. A lot of people on Twitter seemed to be interested in my initial findings, so I asked my boss if it was okay if I published the “proper” results here and he said yes – hence this post.

Setting

Okay, here’s what we’re measuring: we’re playing back a 1280×720 29.97fps Bink 2 video – namely, an earlier cut of this trailer that we have a very high-quality master version of (it’s one of our standard test videos); I’m sure the exact version of the video we use is on the Internet somewhere too, but I didn’t find it within the 2 minutes of googling, so here goes. We’re only using the first 700 frames of the video to speed up testing (700 frames is enough to get a decent sample).

Like most popular video codecs, Bink 2 produces output data in planar YUV, with the U/V color planes sub-sampled 2x both horizontally and vertically. These three planes get uploaded as 3 separate textures (which together form a “texture set”): one 1280×720 texture for luminance (Y) and two 640×360 textures for chrominance (Cb/Cr). (Bink and Bink 2 also support encoding an alpha channel, which adds another 1280×720 texture to the set). All three textures use the GL_LUMINANCE pixel format by default, with GL_UNSIGNED_BYTE data; that is, one byte per texel. This data is converted to RGB using a simple fragment shader.

Every frame, we upload new data for all 3 textures in a set using glTexSubImage2D from the internal video frame buffers, uploading the entire image (we could track dirty regions fairly easily, but with slow uploads this increases frame rate variance, which is a bad thing). We then draw a single quad using the 3 textures and our fragment shader. All very straightforward stuff.

Furthermore, we actually keep two texture sets around – everything is double-buffered. You will see why this is a good idea despite the increased memory consumption in a second.

A wrinkle

One problem with GL ES targets is that the original GL ES went a bit overboard in removing core GL features. One important feature they removed was GL_UNPACK_ROW_LENGTH – this parameter sets the distance between adjacent rows in a client-specified image, counted in pixels. Why would you care about this? Simple: Say you have a 256×256 texture that you want to update from a system memory copy, but you know that you only changed the lower-left 128×128 pixels. By default, glTexSubImage2D with width = height = 128 will assume that the rows of the source image are 128 pixels wide and densely packed. Thus, to update just a 128×128 pixel region, you would have to either copy the lower left 128×128 pixels of your system memory texture into a smaller array that is densely packed, or call glTexSubImage2D 128 times, uploading a row at a time. Neither of these is very appealing from a performance perspective. But if you have GL_UNPACK_ROW_LENGTH, you can just set it to 256 and upload everything with a single call. Much nicer.

The reason Bink 2 needs this is because we support arbitrary-width videos, but like most video codecs, the actual coding is done in terms of larger units. For example, MPEG 1 through to H.264 all use 16×16-pixel “macroblocks”, and any video that is not a multiple of 16 pixels will get padded out to a multiple-of-16-size internally. Even if you didn’t need the extra data in the codec, you would still want adjacent rows in the plane buffers to be multiples of at least 16 pixels, simply so that every row is 16-byte aligned (an important magic number for a lot of SIMD instruction sets). Bink 2′s equivalent of macroblocks is 32×32 pixels in size, so we internally want rows to be a multiple of 32 pixels wide.

What this all means is that if you decide you really want a 65×65 pixel video, that’s fine, but we’re going to allocate our internal buffers as if it was 96 pixels wide (and 80 pixels tall – we can omit storage for the last 16 rows in the last macroblock). Which is where the unpack row length comes into play – if we have it, we can support “odd-sized” videos efficiently; if we don’t, we have to use the slower fallback, i.e. call glTexSubImage2D for every scan line individually. Luckily, there is the GL_EXT_unpack_subimage GL ES extension that adds this feature back in and is available on most recent devices; but for “odd” sizes on older devices, we’re stuck with uploading a row at a time.

That said, none of this affects our test video, since 1280 pixels width is a multiple of 32; I just though I’d mention it anyway since it’s one of random, non-obvious API compatibility issues you run into. Anyway, back to the subject.

Measuring texture updates

Okay, so here’s what I did: Bink 2 decodes the video on another (or multiple other) threads. Periodically – ideally, 30 times a second – we upload the current frame and draw it to the screen. My test program will never drop any frames; in other words, we may run slower than 30fps, but we will always upload and render all 700 frames, and we will never run faster than 30fps (well, 29.997fps, but close enough).

Around the texture upload, my test program does this:

    // update the GL textures
    clock_t start = clock();
    Update_Bink_textures( &TextureSet, Bink );
    clock_t total = clock() - start;

    upload_stats.record( (float) ( 1000.0 * total / CLOCKS_PER_SEC ) );

where upload_stats is an instance of the RunStatistics class I used in the Optimizing Software Occlusion Culling series. This gives me order statistics, mean and standard deviation for the texture update times, in milliseconds.

I also have several different test variants that I run:

  • GL_LUMINANCE tests upload the texture data as GL_LUMINANCE as explained above. This is the “normal” path.
  • GL_RGBA tests upload the same bytes as a GL_RGBA texture, with all X coordinates (and the texture width) divided by 4. In other words, they transfer the same amount of data (and in fact the same data), just interpreted differently. This was done to check whether RGBA textures enjoy special optimizations in the drivers (spoiler: it seems like they do).
  • use1x1 tests force all glTexSubImage2D calls to upload just 1×1 pixels – in other words, this gives us the cost of API overhead, possible synchronization and texture ghosting while virtually removing any per-pixel costs (such as CPU color space conversion, swizzling, DMA transfers or memory bandwidth).
  • nodraw tests do all of the texture uploading, but then don’t actually draw the quad. This still measures processing time for the texture upload, but since the texture isn’t actually used, no synchronization or ghosting is ever necessary.
  • uploadall uses glTexImage2D instead of glTexSubImage2D to upload the whole texture. In theory, this will guarantee to the driver that all existing texture data is overwritten – so while texture ghosting might still have to allocate memory for a new texture, it won’t have to copy the old contents at least. In practice, it’s not clear if the drivers actually make use of that fact. For obvious reasons, this and use1x1 are mutually exclusive, and I only ran this test on the PowerVR device.

Results

So, without further ado, here’s the results on the 4 devices I tested: (apologies for the tiny font size, but that was the only way to squeeze it into the blog layout)

Device / GPU Format min 25th med 75th max avg sdev
2010 Droid X (PowerVR SGX 530) GL_LUMINANCE 14.190 15.472 17.700 20.233 70.893 19.704 5.955
GL_RGBA 11.139 13.245 14.221 14.832 28.412 14.382 1.830
GL_LUMINANCE use1x1 0.061 38.269 39.398 41.077 93.750 41.905 6.517
GL_RGBA use1x1 0.061 30.761 32.348 32.837 59.906 33.165 4.305
GL_LUMINANCE nodraw 9.979 12.726 13.427 14.985 29.632 13.854 1.788
GL_RGBA nodraw 5.188 10.376 11.291 12.024 26.215 10.864 2.013
GL_LUMINANCE use1x1 nodraw 0.030 0.061 0.061 0.092 0.733 0.086 0.058
GL_RGBA use1x1 nodraw 0.030 0.061 0.061 0.091 0.916 0.082 0.081
GL_LUMINANCE uploadall 13.611 15.106 17.822 19.653 73.944 19.312 6.145
GL_RGBA uploadall 7.171 12.543 13.489 14.282 34.119 13.751 1.854
GL_LUMINANCE uploadall nodraw 9.491 12.756 13.702 14.862 33.966 13.994 2.176
GL_RGBA uploadall nodraw 5.158 9.796 10.956 11.718 22.735 10.465 2.135
2012 Nexus 7 (Nvidia Tegra 3) GL_LUMINANCE 6.659 7.706 8.710 10.627 18.842 9.597 2.745
GL_RGBA 3.278 3.600 4.128 4.906 9.244 4.395 1.011
GL_LUMINANCE use1x1 0.298 0.361 0.421 0.567 1.843 0.468 0.151
GL_RGBA use1x1 0.297 0.354 0.422 0.561 1.687 0.468 0.152
GL_LUMINANCE nodraw 6.690 7.674 8.669 9.815 24.035 9.495 2.929
GL_RGBA nodraw 3.208 3.501 3.973 5.974 12.059 4.737 1.589
GL_LUMINANCE use1x1 nodraw 0.295 0.360 0.413 0.676 1.569 0.520 0.204
GL_RGBA use1x1 nodraw 0.270 0.327 0.404 0.663 1.946 0.506 0.234
2013 Nexus 7 (Qualcomm Adreno 320) GL_LUMINANCE 0.732 0.976 1.190 3.907 22.249 2.383 1.879
GL_RGBA 0.610 0.824 0.977 3.510 13.368 2.163 1.695
GL_LUMINANCE use1x1 0.030 0.061 0.061 0.091 3.143 0.080 0.187
GL_RGBA use1x1 0.030 0.061 0.091 0.092 4.303 0.104 0.248
GL_LUMINANCE nodraw 0.793 1.098 3.570 4.425 25.760 3.001 2.076
GL_RGBA nodraw 0.732 0.916 1.038 3.937 26.370 2.416 2.190
GL_LUMINANCE use1x1 nodraw 0.030 0.061 0.091 0.092 4.181 0.090 0.204
GL_RGBA use1x1 nodraw 0.030 0.061 0.091 0.122 4.272 0.114 0.292
2012 Nexus 10 (ARM Mali T604) GL_LUMINANCE 1.292 2.782 3.590 4.439 16.893 3.656 1.256
GL_RGBA 1.451 2.782 3.432 4.358 8.517 3.551 0.982
GL_LUMINANCE use1x1 0.193 0.284 0.369 0.670 17.598 0.862 2.230
GL_RGBA use1x1 0.100 0.147 0.199 0.313 20.896 0.656 2.349
GL_LUMINANCE nodraw 1.314 2.179 2.320 2.823 10.677 2.548 0.700
GL_RGBA nodraw 1.209 2.101 2.196 2.539 5.008 2.414 0.553
GL_LUMINANCE use1x1 nodraw 0.190 0.294 0.365 0.601 2.113 0.456 0.228
GL_RGBA use1x1 nodraw 0.094 0.119 0.162 0.288 2.771 0.217 0.162

Yes, bunch of raw data, no fancy graphs – not this time. Here’s my observations:

  • GL_RGBA textures are indeed a good deal faster than luminance ones on most devices. However, the ratio is not big enough to make CPU-side color space conversion to RGB (or even just interleaving the planes into an RGBA layout on the CPU side) a win, so there’s not much to do about it.
  • Variability between devices is huge. Hooray for fragmentation.
  • Newer devices tend to have fairly reasonable texture upload times, but there’s still lots of variation.
  • Holy crap does the Droid X show badly in this test – it has both really slow upload times and horrible texture ghosting costs, and that despite us already alternating between a pair of texture sets! I hope that’s a problem that’s been fixed in the meantime, but since I don’t have any newer PowerVR devices here to test with, I can’t be sure.

So, to summarize it in one word: Ugh.


Native debugging on Android

$
0
0

Another Android post. As you can tell by the previous post, I’ve been doing some testing on Android lately, and before that came building, deploying, and testing/debugging. As part of the latter, I was trying to get ndk-gdb to work, on which I spent about one and a half day full-time (without success), and then later about as much time waiting (and sometimes answering questions) when some Android devs on Twitter took pity on me and helped me figure the problem out. Since I found no mention of this issue in the usual places (Stack Overflow etc.), I’m writing it up here in case someone else runs into the same issues later.

First problem: Android 4.3

The symptom here is that ndk-gdb won’t be able to successfully start the target app at all, and dies pretty early with an error. “Package is unknown”, “data directory not found” or something similar. This is apparently something that got broken in the update to Android 4.3 – see this issue in the Android bug tracker. If you run into this problem with Android 4.3 running on an “official” Google device (i.e. the Nexus-branded ones), it can be fixed by flashing the device to use the Google-provided Factory Images with Android 4.3. If you’re not on a Nexus device – well, sucks to be you; there’s some other workarounds mentioned in the issue, and Google says that the problem will be fixed in a “future release”, but for now you’re out of luck.

Second problem: “Waiting for Debugger” – NDK r9 vs. JDK 7

The second problem occurs a bit further down the line: ndk-gdb actually manages to launch the app on the phone and gets into gdb, but the app then freezes showing a “Waiting for Debugger” screen and won’t continue no matter what you do. Note that there are lots of ways to get stuck at that screen, see Stack Overflow and the like; in particular, if you see that screen even when launching the app directly on the Android device (instead of starting it via ndk-gdb --start or ndk-gdb --launch on the host), this is a completely different problem and what I’m describing here doesn’t apply.

Anyway, this one took ages to figure out. After about two days (when I had managed to find the original problem I was trying to debug on a colleague’s machine, where ndk-gdb worked), I realized that everything seemed to work fine on his machine, which had an older Android NDK, but did not work on two of my machines, which were both using NDK r9. So I went over the change log for r9 to check if there was anything related to ndk-gdb, and indeed, there was this item:

  • Updated ndk-gdb script so that the --start or --launch actions now wait for the GNU Debug Server, so that it can more reliably hit breakpoints set early in the execution path (such as breakpoints in JNI code). (Issue 41278)

    Note: This feature requires jdb and produces warning about pending breakpoints. Specify the --nowait option to restore previous behavior.

Aha! Finally, a clue. So I tried running my projects with ndk-gdb --start --nowait, and indeed, that worked just fine (in retrospect, I should have searched for a way to disable the wait sooner, but hindsight is always 20/20). That was good enough for me, although it meant I didn’t get to enjoy the fix for the Android issue cited in the change log. This is annoying, but not hard to work around: just sleep for a few seconds early in your JNI main function to give the debugger time to attach. I was still curious about what’s going on though, but I had absolutely no clue how to proceed from there – digging into it any further would’ve required knowledge of internals that I just didn’t have.

This is when an Android developer on Twitter offered to step in and see if he could figure it out for me; all I had to do was give him some debug logs. Fair enough! And today around noon, he hit paydirt.

Okay, so here’s the problem: as the change log entry notes, the “wait for debugger” is handled in the Java part of the app and goes through jdb (the Java debugger), whereas the native code side is handled by gdbserver and gdb. And the problem was on the Java side of the fence, which I really don’t know anything about. Anyway, I could attach jdb just fine (and run jdb commands successfully), but the wait dialog on the Android phone just wouldn’t go away no matter what I did. It turns out that the problem was caused by me using JDK 7, when Android only officially supports JDK 6. Everything else that I’ve tried worked fine, and none of the build (or other) Android SDK scripts complained about the version mismatch, but apparently on the Android side, things won’t work correctly if a JDK 7 version of jdb tries to connect. And while you’re at it, make sure you’re using a 32-bit JDK too, even if you’re on a 64-bit machine; I didn’t make that mistake, but apparently that one can cause problems too. After I switched to the 32-bit JDK6u38 from here (the old Java JDK site, which unlike the new Oracle-hosted site won’t make you create an user account if you want to download old versions) things started working: I can now use ndk-gdb just fine, and it properly waits for the debugger to attach so I can set breakpoints as early as I like without resorting to the sleep hack.

Summary (aka TL;DR)

Use Android 4.2 or older, or flash to the “factory image” if you want native debugging to even start.

If you’re using the NDK r9, make sure you’re using a 32-bit JDK 6 (not 7) or you might get stuck at the “Waiting for Debugger” prompt indefinitely.

Thanks to Branimir Karadžić for pointing out the first issue to me (if I hadn’t known that it was a general Android 4.3 thing, I would’ve wasted a lot of time on this), and huge thanks to Justin Webb for figuring out the second one!

Well done, Android. The Enrichment Center once again reminds you that Android Hell is a real place where you will be sent at the first sign of defiance.


Bit scanning equivalencies

$
0
0

A lot of bit manipulation operations exist basically everywhere: AND, OR, XOR/EOR, shifts, and so forth. Some exist only on some architectures but have obvious implementations everywhere else – NAND, NOR, equivalence/XNOR and so forth.

Some exist as built-in instructions on some architectures and require fairly lengthy multi-instruction sequences when they’re not available. Some examples would be population count (number of bits set; available on recent x86s and POWER but not PowerPC), or bit reversal (available on ARMv6T2 and above).

And then there’s bit scanning operations. All of these can be done fairly efficiently on most architectures, but it’s not always obvious how.

x86 bit scanning operations

On x86, there’s BSF (bit scan forward), BSR (bit scan reverse), TZCNT (trailing zero count) and LZCNT (leading zero count). The first two are “old” (having existed since 386), the latter are very new. BSF and TZCNT do basically the same thing, with one difference: BSF has “undefined” results on a zero input (what is the index of the first set bit in the integer 0?), whereas the “trailing zeros” definition for TZCNT provides an obvious answer: the width of the register. BSR returns the index of the “last” set bit (again undefined on 0 input), LZCNT returns the number of leading zero bits, so these two actually produce different results.

  • x86_bsf(x) = x86_tzcnt(x) unless x=0 (in which case bsf is undefined).
  • x86_bsr(x) = (reg_width - 1) - x86_lzcnt(x) unless x=0 (in which case bsr is undefined).

In the following, I’ll only use LZCNT and TZCNT (use above table to convert where necessary) simply to avoid that nasty edge case at 0.

PowerPC bit scanning operations

PPC has cntlzw (Count Leading Zeros Word) and cntlzd (Count Leading Zeros Double Word) but no equivalent for trailing zero bits. We can get fairly close though: there’s the old trick x & -x which clears all but the lowest set bit in x. As long as x is nonzero, this value has exactly one bit set, and we can determine its position using a leading zero count.

  • x86_tzcnt(x) = (reg_width - 1) - ppc_cntlz(x & -x) unless x=0 (in which case the PPC expression returns -1).
  • x86_lzcnt(x) = ppc_cntlz(x).

ARM bit scanning operations

ARM also has CLZ (Count Leading Zeros) but nothing for trailing zero bits. But it also offers the aforementioned RBIT which reverses the bits in a word, which makes a trailing zero count easy to accomplish:

  • x86_tzcnt(x) = arm_clz(arm_rbit(x)).
  • x86_lzcnt(x) = arm_clz(x).

Bonus

Finally, ARMs NEON also offers VCLS (Vector Count Leading Sign Bits), which (quoting from the documentation) “counts the number of consecutive bits following the topmost bit, that are the same as the topmost bit”. Well, we can do that on all architectures I mentioned as well, using only ingredients we already have: arm_cls(x) = x86_lzcnt(x ^ (x >> 1)) - 1 (the shift here is an arithmetic shift). The expression y = x ^ (x >> 1) gives a value that has bit n set if and only if bits n and n + 1 of x are the same. By induction, the number of leading zeros in y is thus exactly the number of leading bits in x that match the sign bit. This count includes the topmost (sign) bit, so it’s always at least 1, and the instruction definition I just quoted requires us to return the number of bits following the topmost bit that match it. So we subtract 1 to get the right result. Since we can do a fast leading zero count on all quoted platforms, we’re good.

Conclusion: bit scans / zero bit counts in either direction can be done fairly efficiently on all architectures covered, but you need to be careful when zeros are involved.


Bink 2.2 integer DCT design, part 1

$
0
0

This subject is fairly technical, and I’m going to proceed at a somewhat higher speed than usual; part of the reason for this post is just as future reference material for myself.

DCTs

There’s several different types of discrete cosine transforms, or DCTs for short. All of them are linear transforms on N-dimensional vectors (i.e. they can be written as a N×N matrix), and they all relate to larger real DFTs (discrete Fourier transforms) in some way; the different types correspond to different boundary conditions and different types of symmetries. In signal processing and data compression, the most important variants are what’s called DCT-II through DCT-IV. What’s commonly called “the” DCT is the DCT-II; this is the transform used in, among other things, JPEG, MPEG-1 and MPEG-2. The DCT-III is the inverse of the DCT-II (up to scaling, depending on how the two are normalized; there’s different conventions in use). Thus it’s often called “the” IDCT (inverse DCT). The DCT-IV is its own inverse, and forms the basis for the MDCT (modified DCT), a lapped transform that’s at the heart of most popular perceptual audio codecs (MP3, AAC, Vorbis, and Opus, among others). DCTs I and V-VIII also exist but off the top of my head I can’t name any signal processing or data compression applications that use them (which doesn’t mean there aren’t any).

Various theoretical justifications exist for the DCT’s use in data compression; they are quite close to the optimal choice of orthogonal basis for certain classes of signals, the relationship to the DFT means there are fast (FFT-related) algorithms available to compute them, and they are a useful building block for other types of transforms. Empirically, after 25 years of DCT-based codecs, there’s little argument that they work fairly well in practice too.

Image (and video) codecs operate on 2D data; like the DFT, there are 2D versions of all DCTs that are separable: a 2D DCT of a M×N block decomposes into N 1D M-element DCTs on the columns followed by M N-element DCTs on the rows (or vice versa). JPEG and the MPEGs up to MPEG-4 ASP use 2D DCTs on blocks of 8×8 pixels. H.264 (aka MPEG-4 AVC) initially switched to 4×4 blocks, then added the 8×8 blocks back in as part of the “High” profile later. H.265 / HEVC has both sizes and also added support for 16×16 and 32×32 transform blocks. Bink 2 sticks with 8×8 DCTs on the block transform level.

Algorithms

There are lots of different DCT algorithms, and I’m only going to mention a few of them. Like the DFT, DCTs have a recursive structure that allows them to be implemented in O(N log N) operations, instead of the O(N2) operations a full matrix-vector multiply would take. Unlike the FFT, which decomposes into nothing but smaller FFTs except for some multiplications by scalars (“twiddle factors”) plus a permutation, the recursive factorizations of one DCT type will usually contain other trigonometric transforms – both smaller DCTs and smaller DST (discrete sine transforms) of varying types.

The first important dedicated DCT algorithm is presented in [Chen77] (see references below), which provides a DCT factorization for any power-of-2 N which is substantially faster than computing the DCT using a larger FFT. Over a decade later, [LLM89] describes a family of minimum-complexity (in terms of number of arithmetic operations) solutions for N=8 derived using graph transforms, a separate algorithm that has no more than one multiply along any path (this is the version used in the IJG JPEG library), and a then-new fast algorithm for N=16, all in a 4-page paper. [AAN88] introduces a scaled algorithm for N=8 which greatly reduces the number of multiplications. A “scaled” DCT is one where the output coefficients have non-uniform scaling factors; compression applications normally follow up the DCT with a quantization stage and precede the IDCT with a dequantization stage. The scale factors can be folded into the quantization / dequantization steps, which makes them effectively “free”. From today’s perspective, the quest for a minimal number of multiplies in DCT algorithms seems quaint; fast, pipelined multipliers are available almost everywhere these days, and today’s mobile phone CPUs achieve floating point throughputs higher than those of 1989′s fastest supercomputers (2012 Nexus 4: 2.8 GFLOPS measured with RgbenchMM; Cray-2: 1.9 GFLOPS peak – let that sink in for a minute). That said, the “scaled DCT” idea is important for other reasons.

There’s also direct 2D methods that can reduce number of arithmetic operations further relative to a separable 1D implementation; however, the overall reduction isn’t very large, the 2D algorithms require considerably more code (instead of 2 loops processing N elements each, there is a single “unrolled” computation processing N2 elements), and they have data flow patterns that are unfriendly to SIMD or hardware implementations (separable filters, on the other hand, are quite simple to implement in a SIMD fashion).

For 1D DCTs and N=8, the situation hasn’t substantially changed since the 1980s. Larger DCTs (16 and up) have seen some improvement on their arithmetic operation costs in recent years [Plonka02] [Johnson07], with algorithms derived symbolically from split-radix FFTs (though again, how much of a win the better algorithms are heavily depends on the environment).

Building blocks

Independent of the choice of DCT algorithm, they all break down into the following 3 basic components:

  • Butterflies. A butterfly is the transform (a, b) \mapsto (a + b, a - b) (they’re called that way because of how they’re drawn in diagram form). A butterfly is also its own inverse, up to a scale factor of two, since (a+b) + (a-b) = 2a and likewise (a+b) - (a-b) = 2b.
  • Planar rotations. Take a pair of values, interpret them as coordinates in the plane, and rotate them about the origin. I’ve written about them (even in the context of DCTs) before. The inverse of a rotation by θ radians is a rotation by -θ radians. There’s also planar reflections which are closely related to rotations and work out pretty much the same on the implementation side. Reflections are self-inverse, and in fact a butterfly is just a reflection scaled by \sqrt{2}.
  • Scalar multiplies. Map a \mapsto ca for some nonzero constant c. The inverse is scaling by 1/c.

There are also a few properties of the DCT-II that simplify the situation further. Namely, the DCT-II (when properly normalized) is an orthogonal transform, which means it can be decomposed purely into planar rotations and potentially a few sign flips at the end (which can be represented as scalar multiplications). Butterflies, being as they are a scaled reflection, are used because they are cheaper than a “proper” rotation/reflection, but they introduce a scale factor of \sqrt{2}. So scalar multiplications are used to normalize the scaling across paths that go through a different number of butterflies; but the DCT algorithms we’re considering here only have scaling steps at the end, which can conveniently be dropped if a non-normalized (scaled) DCT is acceptable.

What this all boils down to is that a DCT implementation basically boils down to which planar rotations are performed when, and which of the various ways to perform rotations are employed. There are tons of tricky trade-offs here, and which variant is optimal really depends on the target machine. Older standards (JPEG, the earlier MPEGs) didn’t specify exactly which IDCT was to be used by decoders, leaving this up to the implementation. Every codec had its own DCT/IDCT implementations, which caused problems when a video was encoded using codec A and decoded using codec B – basically, over time, the decoded image could drift from what the encoder intended. Some codecs even had multiple DCT implementations with different algorithms (say one for MMX, and another for SSE2-capable CPUs) so this problem occurred even between different machines using the same codec. And of course there’s the general problem that the “real” DCT involves irrational numbers as coefficients, so there’s really no efficient way to compute it exactly for arbitrary inputs.

Integer transforms

The solution to all these problems is to pick a specific IDCT approximation and specify it exactly – preferably using (narrow) integer operations only, since floating-point is expensive in hardware implementations and getting 100% bit-identical results for floating-point calculations across multiple platforms and architectures is surprisingly hard in software.

So what denotes a good integer DCT? It depends on the application. As the title says, this post is about the 8×8 integer IDCT (and matching DCT) design used for Bink 2.2. We had the following requirements:

  • Bit-exact implementation strictly required (Bink 2 will often go hundreds or even thousands of frames without a key frame). Whatever algorithm we use, it must be exactly the same on all targets.
  • Must be separable, i.e. the 2D DCT factors into 1D DCT steps.
  • Must be a close approximation to the DCT. The goal was to be within 2% in terms of the matrix 2-norm, and same for the coding gain compared to a “proper” DCT. Bink 2 was initially designed with a full-precision floating-point (or high-precision fixed point) DCT in mind and we wanted a drop-in solution that wouldn’t affect the rest of the codec too much.
  • Basis vectors must be fully orthogonal (or very close) to allow for trellis quantization.
  • Must have an efficient SIMD implementation on all of the following:
    • x86 with SSE2 or higher in both 32-bit and 64-bit modes.
    • ARM with NEON support.
    • PowerPC with VMX/AltiVec (e.g. PS3 Cell PPU).
    • Cell SPUs (PS3 again).
    • PowerPC with VMX128 (Xbox 360 CPU).

    Yep, lots of game consoles – RAD’s a game middleware company.

  • 16-bit integer preferred, to enable 8-wide operation on 128-bit SIMD instruction sets. To be more precise, for input values in the range [-255,255], we want intermediate values to fit inside 16 bits (signed) through all stages of the transform.

This turns out to limit our design space greatly. In particular, VMX128 removes all integer multiplication operations from AltiVec – integer multiplication by scalars, where desired, has to be synthesized from adds, subtractions and shifts. This constraint ended up driving the whole design.

There’s other integer DCTs designed along similar lines, including several used in other video codecs. However, while there’s several that only use 16-bit integer adds and shifts, they are generally much coarser approximations to the “true” DCT than what we were targeting. Note that this doesn’t mean they’re necessarily worse for compression purposes, or that the DCT described here is “better”; it just means that we wanted a drop-in replacement for the full-precision DCT, and the transform we ended up with is a closer to that goal than published variants with similar complexity.

Building an integer DCT

Most of the integer DCT designs I’m aware of start with a DCT factorization; the Bink 2 DCT is no exception, and starts from the DCT-II factorizations given in [Plonka02]. For N=8, this is equivalent to the factorization described in [LLM89]: by reordering the rows of the butterfly matrices in Plonka’s factorization and flipping signs to turn rotation-reflections into pure rotations, the DCT-II factorization from example 2.8 can be expressed as the butterfly diagram (click to zoom)

[Plonka02] DCT-II factorization for N=8

which corresponds to the DCT variation on the left of the 2nd row in figure 4 of [LLM89], with the standard even part. However, [LLM89] covers only N=8, N=16 and (implicitly) N=4, whereas [Plonka02] provides factorizations for arbitrary power-of-2 N, making it easy to experiment with larger transform sizes with a single basic algorithm. UPDATE: The previous version of the diagram had a sign flip in the rightmost butterfly. Thanks to “terop” for pointing this out in the comments!

Now, we’re allowing a scaled DCT, so the final scale factors of \pm \sqrt{2} can be omitted. As explained above, this leaves butterflies (which have simple and obvious integer implementations) and exactly three rotations, one in the even part (the top half, called “even” since it produces the even-numbered DCT coefficients) and two in the odd part:

DCT rotations

As customary for DCT factorizations, c_k = \cos(k \pi / 2N) and s_k = \sin(k \pi / 2N). Note that due to the corresponding trig identities, we have c_{-k} = c_k, s_{-k} = -s_k, c_{N-k} = s_k and s_{N-k} = c_k, which means that the three rotations we see here (and indeed all rotations referenced in [LLM89]) can be expressed in terms of just c_1, s_1, c_2, s_2, c_3 and s_3.

Now, all we really need to do to get an integer DCT is to pick integer approximations for these rotations (preferably using only adds and shifts, see the constraints above!). One way to do so is the BinDCT [Liang01], which uses the decomposition of rotation into shears I explained previously and then approximates the shears using simple dyadic fractions. This is a cool technique, but yields transforms with basis vectors that aren’t fully orthogonal; how big the non-orthogonality is depends on the quality of approximation, with cheaper approximations being less orthogonal. While not a show-stopper, imperfect orthogonality violates the assumptions inherent in trellis quantization and thus reduces the quality of the rate-distortion optimization performed on the encoder side.

Approximating rotations

So how do we approximate irrational rotations as integers (preferably small integers) with low error? The critical insight is that any matrix of the form

\begin{pmatrix} c & s \\ -s & c \end{pmatrix}, \quad c^2 + s^2 = 1

is a planar rotation about some angle θ such that c=\cos \theta, s=\sin \theta. And more generally, any matrix of the form

\begin{pmatrix} c & s \\ -s & c \end{pmatrix}, \quad c^2 + s^2 \ne 0

is a scaled planar rotation. Thus, if we’re okay with a scaled DCT (and we are), we can just pick two arbitrary integers c, s that aren’t both zero and we get a scaled integer rotation (about some arbitrary angle). To approximate a particular rotation angle θ, we want to ensure that s/c \approx (\sin\theta)/(\cos\theta) = \tan\theta. Since we’d prefer small integer values s and c, we can find suitable approximations simply by enumerating all possibilities with a suitable ratio, checking how closely they approximate the target angle, and using the best one. This is easily done with a small program, and by itself sufficient to find a good solution for the rotation in the even part of the transform.

The odd part is a bit trickier, because it contains two rotations and butterflies that combine the results from different rotations. Therefore, if the two rotations were scaled differently, such a butterfly will result not in a scaled DCT, but a different transformation altogether. So simply approximating the rotations individually won’t work; however, we can approximate the two rotations (c_1,s_1), (c_2,s_2) simultaneously, and add the additional constraint that c_1^2 + s_1^2 = c_2^2 + s_2^2 (somewhat reminiscent of Pythagorean triples), thus guaranteeing that the norm of the two rotations is the same. Initially I was a bit worried that this might over-constrain the problem, but it turns out that even with this extra complication, there are plenty of solutions to choose from. As before, this problem is amenable to an exhaustive search over all small integers that have the right ratios between each other.

Finally, we need implementations of the resulting rotations using only integer additions/subtractions and shifts. Since we’re already fully integer, all this means is that we need to express the integer multiplications using only adds/subtracts and shifts. This is an interesting and very tricky problem by itself, and I won’t cover it here; see books like Hacker’s Delight for a discussion of the problem. I implemented a simple algorithm that just identifies runs of 0- and 1-bits in the binary representation of values. This is optimal for small integers (below 45) but not necessarily for larger ones, but it’s usually fairly good. And since the program already tries out a bunch of variants, I made it compute costs for the different ways to factor planar rotations as well.

The result is findorth.cpp, a small C++ program that finds candidate small integer approximations to the DCT rotations and determines their approximate cost (in number of adds/subtractions and shifts) as well. Armed with this and the rest of the factorization above, it’s easy to come up with several families of integer DCT-like transforms at various quality and cost levels and compare them to existing published ones:

Variant (c2,s2) (c1,s1) (c3,s3) Cost L2 err Gain (dB)
A1 (17,-7)/16 (8,-1)/8 (7,4)/8 32A 10S 0.072 8.7971
B1 (5,-2)/4 (8,-1)/8 (7,4)/8 30A 10S 0.072 8.7968
A2 (17,-7)/16 (19,-4)/16 (16,11)/16 38A 12S 0.013 8.8253
B2 (5,-2)/4 (19,-4)/16 (16,11)/16 36A 12S 0.013 8.8250
A3 (17,-7)/16 (65,-13)/64 (55,37)/64 42A 15S 0.003 8.8258
B3 (5,-2)/4 (65,-13)/64 (55,37)/64 40A 15S 0.012 8.8255
Real DCT - - - - 0.000 8.8259
BinDCT-L1 - - - 40A 22S 0.013 8.8257
H.264 - - - 32A 10S 0.078 8.7833
VC-1 - - - ? 0.078 8.7978

The cost is measured in adds/subtracts (“A”) and shifts (“S”); “L2 err” is the matrix 2-norm of the difference between the approximated DCT matrix and the true DCT, and “gain” denotes the coding gain assuming a first-order Gauss-Markov process with autocorrelation coefficient ρ=0.95 (a standard measure for the quality of transforms in image coding).

These are by far not all solutions that findorth finds, but they’re what I consider the most interesting ones, i.e. they’re at good points on the cost/approximation quality curve. The resulting transforms compare favorably to published transforms at similar cost (and approximation quality) levels; Bink 2.2 uses variant “B2″, which is the cheapest one that met our quality targets. The Octave code for everything in this post is available on Github.

The H.264 transform is patented, and I believe the VC-1 transform is as well. The transforms described in this post are not (to the best of my knowledge), and RAD has no intention of ever patenting them or keeping them secret. Part of the reason for this post is that we wanted to make an integer DCT that is of similar (or higher) quality and comparable cost than those in existing video standards freely available to everyone. And should one of the particular transforms derived in this post turn out to be patent-encumbered, findorth provides everything necessary to derive a (possibly slightly worse, or slightly more expensive) alternative. (Big thanks to my boss at RAD, Jeff Roberts, for allowing and even encouraging me to write all this up in such detail!)

This post describes the basic structure of the transform; I’ll later post a follow-up with the details of our 16-bit implementation, and the derivation for why 16 bits are sufficient provided input data is in the range of [-255,255].

References

[Chen77]
Chen, Wen-Hsiung, C. H. Smith, and Sam Fralick. “A fast computational algorithm for the discrete cosine transform.” Communications, IEEE Transactions on 25.9 (1977): 1004-1009. PDF
[AAN88]
Yukihiro, Arai, Agui Takeshi, and Masayuki Nakajima. “A fast DCT-SQ scheme for images.” IEICE TRANSACTIONS (1976-1990) 71.11 (1988): 1095-1097.
[LLM89]
Loeffler, Christoph, Adriaan Ligtenberg, and George S. Moschytz. “Practical fast 1-D DCT algorithms with 11 multiplications.” Acoustics, Speech, and Signal Processing, 1989. ICASSP-89., 1989 International Conference on. IEEE, 1989. PDF
[Liang01]
Liang, Jie, and Trac D. Tran. “Fast multiplierless approximations of the DCT with the lifting scheme.” Signal Processing, IEEE Transactions on 49.12 (2001): 3032-3044. PDF
[Plonka02]
Plonka, Gerhard, and Manfred Tasche. “Split-radix algorithms for discrete trigonometric transforms.” (2002). PDF
[Johnson07]
Johnson, Steven G., and Matteo Frigo. “A modified split-radix FFT with fewer arithmetic operations.” Signal Processing, IEEE Transactions on 55.1 (2007): 111-119. PDF


Bink 2.2 integer DCT design, part 2

$
0
0

Last time, I talked about DCTs in general and how the core problem in designing integer DCTs are the rotations. However, I promised an 8×8 IDCT that is suitable for SIMD implementation using 16-bit integer arithmetic without multiplies, and we’re not there yet. I’m going to be focusing on the “B2″ variant of the transform in this post, for concreteness. That means the starting point will be this implementation, which is just a scaled version of Plonka’s DCT factorization with the rotation approximations discussed last time.

Normalization

The DCT described last time (and implemented with the Matlab/Octave code above) is a scaled DCT, and I didn’t mention the scale factors last time. However, they’re easy enough to solve for. We have a forward transform matrix, M. Since the rows are orthogonal (by construction), the inverse of M (and hence our IDCT) is its transpose, up to scaling. We can write this as matrix equation I = M^T S M where S ought to be a diagonal matrix. Solving for S yields S = (M M^T)^{-1}. This gives the total scaling when multiplying by both M and M^T; what we really want is a normalizing diagonal matrix N such that \tilde{M} = NM is orthogonal, which means

I = \tilde{M}^T \tilde{M} = M^T N^T N M = M^T (N^2) M

since N is diagonal, so N^2 = S, and again because the two are diagonal this just means that the diagonal entries of N are the square roots of the diagonal entries of S. Then we multiply once by N just before quantization on the encoder side, and another time by N just after dequantization on the decoder side. In practice, this scaling can be folded directly into the quantization/dequantization process, but conceptually they’re distinct steps.

This normalization is the right one to use to compare against the “proper” orthogonal DCT-II. That said, with a non-lifting all-integer transform, normalizing to unit gain is a bad idea; we actually want some gain to reduce round-off error. A good compromise is to normalize everything to the gain of the DC coefficient, which is \sqrt{8} for the 1D transform. Using this normalization ensures that DC, which usually contains a significant amount of the overall energy, is not subject to scaling-induced round-off error and thus reproduced exactly.

In the 2D transform, each coefficient takes part in first a column DCT and then a row DCT (or vice versa). That means the gain of a separable 2D 8×8 DCT is the square of the gain for the 1D DCT, which in our case means 8. And since the IDCT is just the transpose of the DCT, it has the same gain, so following up the 2D DCT with the corresponding 2D IDCT introduces another 8x gain increase, bringing the total gain for the transform → normalize → inverse transform chain up to 64.

Well, the input to the DCT in a video codec is the difference between the actual pixel values and the prediction (usually motion compensation or some geometric/gradient predictor), and with 8-bit input signals that means the input is the difference between two values in [0, 255]. The worst cases are when the predicted value is 0 and the actual value is 255 or vice versa, leading to a worst-case input value range of [-255, 255] for our integer DCT. Multiply this by a gain factor of 64 and you get [-16320, 16320]. Considering that the plan is to have a 16-bit integer implementation, this should make it obvious what the problem is: it all fits, but only just, and we have to be really careful about overflow and value ranges.

Dynamic range

This all falls under the umbrella term of the dynamic range of the transform. The smallest representable non-zero sample values we support are ±1. With 16-bit integer, the largest values we can support are ±32767; -32768 is out since there’s no corresponding positive value. The ratio between the two is the total dynamic range we have to work with. For transforms, it’s customary to define the dynamic range relative to the input value range, not the smallest representable non-zero signal; in our case, the maximum total scaling we can tolerate along any signal path is 32767/255, or about 128.498; anything larger and we might get overflows.

Now, this problem might seem like it’s self-made: as described above, both the forward and inverse transforms have a total gain of 8x, which seems wasteful. Why don’t we, say, leave the 8x gain on the forward transform but try to normalize the inverse transform such that it doesn’t have any extra gain?

Well, yes and no. We can, but it’s addressing the wrong part of the problem. The figures I’ve been quoting so far are for the gain as measured in the 2-norm (Euclidean norm). But for dynamic range analysis, what we need to know is the infinity norm (aka “uniform norm” or “maximum norm”): what is the largest absolute value we’re going to encounter in our vectors? And it turns out that with respect to the infinity norm, the picture looks a bit different.

To see why, let’s start with a toy example. Say we just have two samples, and our transform is a single butterfly:

B = \begin{pmatrix} 1 & 1 \\ 1 & -1 \end{pmatrix}

As covered last time, B is a scaled reflection, its own inverse up to said scaling, and its matrix 2-norm is \sqrt{2} \approx 1.4142. However, B’s infinity-norm is 2. For example, the input vector (1, 1)^T (maximum value of 1) maps to (2, 0)^T (maximum value of 2) under B. In other words, if we add (or subtract) two numbers, we might get a number back that is up to twice as big as either of the inputs – this shouldn’t come as a surprise. Now let’s apply the transpose of B, which happens to be B itself:

B^T B = \begin{pmatrix} 1 & 1 \\ 1 & -1 \end{pmatrix}^2 = \begin{pmatrix} 2 & 0 \\ 0 & 2 \end{pmatrix}

This is just a scaled identity transform, and its 2-norm and infinity norm are 2 exactly. In other words, the 2-norm grew in the second application of B, but with respect to the infinity norm, things were already as bad as they were going to get after the forward transform. And it’s this infinity norm that we need to worry about if we want to avoid overflows.

Scaling along the signal path

So what’s our actual matrix norms along the signal path, with the “B2″ DCT variant from last time? This is why I published the Octave code on Github. Let’s work through the 1D DCT first:

2> M=bink_dct_B2(eye(8));
3> S=diag(8 ./ diag(M*M'));
4> norm(M,2)
ans =  3.4324
5> norm(M,'inf')
ans =  8.7500
6> norm(S*M,2)
ans =  3.2962
7> norm(S*M,'inf')
ans =  8.4881
8> norm(M'*S*M,2)
ans =  8.0000
9> norm(M'*S*M,'inf')
ans =  8.0000

This gives both the 2-norms and infinity norms for first the forward DCT only (M), then forward DCT followed by scaling (S*M), and finally with the inverse transform as well (M'*S*M), although at that point it’s really just a scaled identity matrix so the result isn’t particularly interesting. We can do the same thing with 2D transforms using kron which computes the Kronecker product of two matrices (corresponding to the tensor product of linear maps, which is the mathematical background underlying separable transforms):

10> norm(kron(M,M),'inf')
ans =  76.563
11> norm(kron(S,S) * kron(M,M),2)
ans =  10.865
12> norm(kron(S,S) * kron(M,M),'inf')
ans =  72.047
13> norm(kron(M',M') * kron(S,S) * kron(M,M), 2)
ans =  64.000
14> norm(kron(M',M') * kron(S,S) * kron(M,M), 'inf')
ans =  64.000
15> norm(kron(M',M') * kron(S,S) * kron(M,M) - 64*eye(64), 'inf')
ans = 8.5487e-014
16> 64*eps
ans = 1.4211e-014

As you can see, the situation is very similar to what we saw in the butterfly example: while the 2-norm keeps growing throughout the entire process, the infinity norm actually maxes out right after the forward transform and stays roughly at the same level afterwards. The last two lines are just there to show that the entire 2D transform chain really does come out to be a scaled identity transform, to within a bit more than 6 ulps.

More importantly however, we do see a gain factor of around 76.6 right after the forward transform, and the inverse transform starts out with a total gain around 72; remember that this value has to be less than 128 for us to be able to do the transform using 16-bit integer arithmetic. As said before, it can fit, but it’s a close shave; we have less than 1 bit of headroom, so we need to be really careful about overflow – there’s no margin for sloppiness. And furthermore, while this means that the entire transform fits inside 16 bits, what we really need to make sure is that the way we’re computing it is free of overflows; we need to drill down a bit further.

For this, it helps to have a direct implementation of the DCT and IDCT; a direct implementation (still in Octave) for the DCT is here, and I’ve also checked in a direct IDCT taking an extra parameter that determines how many stages of the IDCT to compute. A “stage” is a set of mutually independent butterflies or rotations that may depend on previous stages (corresponding to “clean breaks” in a butterfly diagram or the various matrix factors in a matrix decomposition).

I’m not going to quote the entire code (it’s not very long, but there’s no point), but here’s a small snippet to show what’s going on:

  % odd stage 4
  c4 = d4;
  c5 = d5 + d6;
  c7 = d5 - d6;
  c6 = d7;

  if stages > 1
    % odd stage 3
    b4 = c4 + c5;
    b5 = c4 - c5;
    b6 = c6 + c7;
    b7 = c6 - c7;

    % even stage 3
    b0 = c0 + c1;
    b1 = c0 - c1;
    b2 = c2 + c2/4 + c3/2; % 5/4*c2 + 1/2*c3
    b3 = c2/2 - c3 - c3/4; % 1/2*c3 - 5/4*c3
    
    % ...
  end

The trick is that within each stage, there are only integer additions and right-shifts (here written as divisions because this is Octave code, but in integer code it should really be shifts and not divisions) of values computed in a previous stage. The latter can never overflow. The former may have intermediate overflows in 16-bit integer, but provided that computations are done in two’s complement arithmetic, the results will be equal to the results of the corresponding exact integer computation modulo 216. So as long as said exact integer computation has a result that fits into 16 bits, the computed results are going to be correct, even if there are intermediate overflows. Note that this is true when computed using SIMD intrinsics that have explicit two’s complement semantics, but is not guaranteed to be true when implemented using 16-bit integers in C/C++ code, since signed overflow in C triggers undefined behavior!

Also note that we can’t compute values such as 5/4*c2 as (5*c2)/4, since the intermediate value 5*c2 can overflow – and knowing as we do already that we have less than 1 bit of headroom left, likely will for some inputs. One option is to do the shift first: 5*(c2/4). This works but throws away some of the least-significant bits. The form c2 + (c2/4) chosen here is a compromise; it has larger round-off error than the preferred (5*c2)/4 but will only overflow if the final result does. The findorth tool described last time automatically determines expressions in this form.

Verification

Okay, that’s all the ingredients we need. We have the transform decomposed into separate stages; we know the value range at the input to each stage, and we know that if both the inputs and the outputs fit inside 16 bits, the results computed in each stage will be correct. So now all we need to do is verify that last bit – are the outputs of the intermediate stages all 16 bits or less?

2> I=eye(8);
3> F=bink_dct_B2(I);
4> S=diag(8 ./ diag(F*F'));
5> Inv1=bink_idct_B2_partial(I,1);
6> Inv2=bink_idct_B2_partial(I,2);
7> Inv3=bink_idct_B2_partial(I,3);
8> Inv4=bink_idct_B2_partial(I,4);
9> Scaled=kron(S,S) * kron(F,F);
10> norm(kron(I,I) * Scaled, 'inf')
ans =  72.047
11> norm(kron(I,Inv1) * Scaled, 'inf')
ans =  72.047
12> norm(kron(I,Inv2) * Scaled, 'inf')
ans =  77.811
13> norm(kron(I,Inv3) * Scaled, 'inf')
ans =  77.811
14> norm(kron(I,Inv4) * Scaled, 'inf')
ans =  67.905
15> norm(kron(Inv1,Inv4) * Scaled, 'inf')
ans =  67.905
16> norm(kron(Inv2,Inv4) * Scaled, 'inf')
ans =  73.337
17> norm(kron(Inv3,Inv4) * Scaled, 'inf')
ans =  73.337
18> norm(kron(Inv4,Inv4) * Scaled, 'inf')
ans =  64.000

Lines 2-4 compute the forward DCT and scaling matrices. 5 through 9 compute various partial IDCTs (Inv4 is the full IDCT) and the matrix representing the results after the 2D forward DCT and scaling. After that, we successively calculate the norms of more and more of the 2D IDCT: no IDCT, first stage of row IDCT, first and second stage of row IDCT, …, full row IDCT, full row IDCT and first stage of column IDCT, …, full 2D IDCT.

Long story short, the worst matrix infinity norm we have along the whole transform chain is 77.811, which is well below 128; hence the Bink B2 IDCT is overflow-free for 8-bit signals when implemented using 16-bit integers.

A similar process can be used for the forward DCT, but in our case, we just implement it in 32-bit arithmetic (and actually floating-point arithmetic at that, purely for convenience). The forward DCT is only used in the encoder, which spends a lot more time per block than the decoder ever does, and almost none of it in the DCT. Finally, there’s the scaling step itself; there’s ways to do this using only 16 bits on the decoder side as well (see for example “Low-complexity transform and quantization in H. 264/AVC”), but since the scaling only needs to be applied to non-zero coefficients and the post-quantization DCT coefficients in a video codec are very sparse, it’s not a big cost to do the scaling during entropy decoding using regular, scalar 32-bit fixed point arithmetic. And if the scaling is designed such that no intermediate values ever take more than 24 bits (which is much easier to satisfy than 16), this integer computation can be performed exactly using floating-point SIMD too, on platforms where 32-bit integer multiplies are slow.

And that’s it! Congratulations, you now know everything worth knowing about Bink 2.2′s integer DCTs. :)


Simple lossless(*) index buffer compression

$
0
0

(Almost) everyone uses indexed primitives. At this point, the primary choice is between indexed triangle lists, which are flexible but always take 3 indices per triangle, and indexed triangle strips; since your meshes are unlikely to be one big tri strip, that’s gonna involve primitive restarts of some kind. So for a strip with N triangles, you’re generally gonna spend 3+N indices – 2 indices to “prime the pump”, after which every new index will emit a new triangle, and finally a single primitive restart index at the end (supposing your HW target does have primitive restarts, that is).

Indexed triangle strips are nice because they’re smaller, but finding triangle strips is a bit of a pain, and more importantly, long triangle strips actually aren’t ideal because they tend to “wander away” from the origin triangle, which means they’re not getting very good mileage out of the vertex cache (see, for example, Tom Forsyth’s old article on vertex cache optimization).

So here’s the thing: we’d like our index buffers for indexed tri lists to be smaller, but we’d also like to do our other processing (like vertex cache optimization) and then not mess with the results – not too much anyway. Can we do that?

The plan

Yes we can (I had this idea a while back, but never bothered to work out the details). The key insight is that, in a normal mesh, almost all triangles share an edge with another triangle. And if you’ve vertex-cache optimized your index buffer, two triangles that are adjacent in the index buffer are also quite likely to be adjacent in the geometric sense, i.e. share an edge.

So, here’s the idea: loop over the index buffer. For each triangle, check if it shares an edge with its immediate successor. If so, the two triangles can (in theory anyway) be described with four indices, rather than the usual six (since two vertices appear in both triangles).

But how do we encode this? We could try to steal a bit somewhere, but in fact there’s no need – we can do better than that.

Suppose you have a triangle with vertex indices (A, B, C). The choice of which vertex is first is somewhat arbitrary: the other two even cycles (B, C, A) and (C, A, B) describe the same triangle with the same winding order (and the odd cycles describe the same triangle with opposite winding order, but let’s leave that alone). We can use this choice to encode a bit of information: say if A≥B, we are indeed coding a triangle – otherwise (A<B), what follows will be two triangles sharing a common edge (namely, the edge AB). We can always pick an even permutation of triangle indices such that A≥B, since for any integer A, B, C we have

0 = (A - A) + (B - B) + (C - C) = (A - B) + (B - C) + (C - A)

Because the sum is 0, not all three terms can be negative, which in turn means that at least one of A≥B, B≥C or C≥A must be true. Furthermore, if A, B, and C are all distinct (i.e. the triangle is non-degenerate), all three terms are nonzero, and hence we must have both negative and positive terms for the sum to come out as 0.

Paired triangles

Okay, so if the triangle wasn’t paired up, we can always cyclically permute the vertices such that A≥B. What do we do when we have two triangles sharing an edge, say AB?

Two triangles sharing edge AB.

Two triangles sharing edge AB.

For this configuration, we need to send the 4 indices A, B, C, D, which encode the two triangles (A, B, C) and (A, D, B).

If A<B, we can just send the 4 indices directly, leading to this very simple decoding algorithm that unpacks our mixed triangle/double-triangle indexed buffer back to a regular triangle list:

  1. Read 3 indices A, B, C.
  2. Output triangle (A, B, C).
  3. If A<B, read another index D and output triangle (A, D, B).

Okay, so this works out really nicely if A<B. But what if it’s not? Well, there’s just two cases left. If A=B, the shared edge is a degenerate edge and both triangles are degenerate triangles; not exactly common, so the pragmatic solution is to say “if either triangle is degenerate, you have to send them un-paired”. That leaves the case A>B; but that means B<A, and BA is also a shared edge! In fact, we can simply rotate the diagram by 180 degrees; this swaps the position of (B,A) and (C,D) but corresponds to the same triangles. With the algorithm above, (B, A, D, C) will decode as the two triangles (B, A, D), (B, C, A) – same two triangles as before, just in a different order. So we’re good.

Why this is cool

What this means is that, under fairly mild assumptions (but see “limitations” section below), we can have a representation of index buffers that mixes triangles and pairs of adjacent triangles, with no need for any special flag bits (as recommended in Christer’s article) or other hackery to distinguish the two.

In most closed meshes, every triangle has at least one adjacent neighbor (usually several); isolated triangles are very rare. We can store such meshes using 4 indices for every pair of triangles, instead of 6, for about a 33% reduction. Furthermore, most meshes in fact contain a significant number of quadriliterals (quads), and this representation supports quads directly (stored with 4 indices). 33% reduction for index buffers isn’t a huge deal if you have “fat” vertex formats, but for relatively small vertices (as you have in collision detection, among other things), indices can actually end up being a significant part of your overall mesh data.

Finally, this is simple enough to decode that it would probably be viable in GPU hardware. I wouldn’t hold my breath for that one, just thought I might point it out. :)

Implementation

I wrote up a quick test for this and put it on Github, as usual. This code loads a mesh, vertex-cache optimizes the index buffer (using Tom’s algorithm), then checks for each triangle whether it shares an edge with its immediate successor and if so, sends them as a pair – otherwise, send the triangle alone. That’s it. No attempt is made to be more thorough than that; I just wanted to be as faithful to the original index buffer as possible.

On the “Armadillo” mesh from the Stanford 3D scanning repository, the program outputs this: (UPDATE: I added some more features to the sample program and updated the results here accordingly)

172974 verts, 1037832 inds.
before:
ACMR: 2.617 (16-entry FIFO)
62558 paired tris, 283386 single
IB inds: list=1037832, fancy=975274 (-6.03%)
after:
ACMR: 0.814 (16-entry FIFO)
292458 paired tris, 53486 single
IB inds: list=1037832, fancy=745374 (-28.18%)
745374 inds packed
1037832 inds unpacked
index buffers match.
ACMR: 0.815 (16-entry FIFO)

“Before” is the average cache miss rate (vertex cache misses/triangle) assuming a 16-entry FIFO cache for the original Armadillo mesh (not optimized). As you can see, it’s pretty bad.

I then run the simple pairing algorithm (“fancy”) on that, which (surprisingly enough) manages to reduce the index list size by about 6%.

“After” is after vertex cache optimization. Note that Tom’s algorithm is cache size agnostic; it does not assume any particular vertex cache size, and the only reason I’m dumping stats for a 16-entry FIFO is because I had to pick a number and wanted to pick a relatively conservative estimate. As expected, ACMR is much better; and the index buffer packing algorithm reduces the IB size by about 28%. Considering that the best possible case is a reduction of 33%, this is quite good. Finally, I verify that packing and unpacking the index buffer gives back the expected results (it does), and then re-compute the ACMR on the unpacked index buffer (which has vertices and triangles in a slightly different order, after all).

Long story short: it works, even the basic “only look 1 triangle ahead” algorithm gives good results on vertex cache optimized meshes, and the slight reordering performed by the algorithm does not seem to harm vertex cache hit rate much (on this test mesh anyway). Apologies for only testing on one 3D-scanned mesh, but I don’t actually have any realistic art assets lying around at home, and even if I did, loading them would’ve probably taken me more time than writing the entire rest of this program did.

UPDATE: Some more results

The original program was missing one more step that is normally done after vertex cache optimization: reordering the vertex buffer so that vertices appear in the order they’re referenced from the index buffer. This usually improves the efficiency of the pre-transform cache (as opposed to the post-transform cache that the vertex cache optimization algorithm takes care of) because it gives better locality of reference, and has the added side effect of also making the index data more compressible for general purpose lossless compression algorithms like Deflate or LZMA.

Anyway, here’s the results for taking the entire Armadillo mesh – vertices, which just store X/Y/Z position as floats, and 32-bit indices both – and processing it with some standard general-purpose compressors at various stages of the optimization process: (all sizes in binary kilobytes, KiB)

Stage Size .zip size .7z size
Original mesh 6082k 3312k 2682k
Vertex cache optimized 6082k 2084k 1504k
Postprocessed 4939k (-18.8%) 1830k (-12.2%) 1340k (-10.9%)

So the post-process yields a good 10% reduction in the compressed size for what would be the final packaged assets here. This value is to be taken with a grain of salt: “real” art assets have other per-vertex data besides just 12 bytes for the 3D position, and nothing I described here does anything about vertex data. In other words, this comparison is on data that favors the algorithm in the sense that roughly half of the mesh file is indices, so keep that in mind. Still, 10% reduction post-LZMA is quite good for such a simple algorithm, especially compared to the effort it takes to get the same level of reduction on, say, x86 code.

Also note that the vertex cache optimization by itself massively helps the compressors here; the index list for this mesh comes from a 3D reconstruction of range-scanned data and is pathologically bad (the vertex order is really quite random), but the data you get out of a regular 3D mesh export is quite crappy too. So if you’re not doing any optimization on your mesh data yet, you should really consider doing so – it will reduce both your frame timings and your asset sizes.

Limitations

This is where the (*) from the title comes in. While I think this is fairly nice, there’s two cases where you can’t use this scheme, at least not always:

  1. When the order of vertices within a triangle matters. An example would be meshes using flat attribute interpolation, where the value chosen for a primitive depends on the “provoking vertex”. And I remember some fairly old graphics hardware where the Z interpolation depended on vertex specification order, so you could get Z-fighting between the passes in multi-pass rendering if they used different subsets of triangles.
  2. When the order of triangles within a mesh matters (remember that we in the two-tris case, we might end up swapping them to make the encoding work). Having the triangles in a particular order in the index buffer can be very useful with alpha blending, for example. That said, the typical case for this application is that the index buffer partitions into several chunks that should be drawn in order, but with no particular ordering requirements within that chunk, which is easy to do – just prohibit merging tris across chunk boundaries.

That said, it seems to me that it really should be useful in every case where you’d use a vertex cache optimizer (which messes with the order anyway). So it’s probably fine.

Anyway, that’s it. No idea whether it’s useful to anyone, but I think it’s fairly cute, and it definitely seemed worth writing up.


Index compression follow-up

$
0
0

I got a few mails about the previous post, including some pretty cool suggestions that I figured were worth posting.

Won Chun (who wrote a book chapter for OpenGL insights on the topic, “WebGL Models: End-to-End”) writes: (this is pasted together from multiple mails; my apologies)

A vertex-cache optimized list is still way more compressible than random: clearly there is lots of coherence to exploit. In fact, that’s pretty much with the edge-sharing-quad business is (OK, some tools might do this because they are working naturally in quads, but you get lots of these cases with any vertex cache optimizer).

So you can also get a pretty big win by exploiting pre-transform vertex cache optimization. I call it “high water mark encoding.” Basically: for such a properly optimized index list, the next index you see is either (a) one you’ve seen before or (b) one higher than the current highest seen index. So, instead of encoding actual indices, you can instead encode them relative to this high water mark (the largest index yet to be seen, initialized to 0). You see “n” and that corresponds to an index of (high water mark – n). When you see 0, you also increment high watermark.

The benefit here is that the encoded indices are very small, and then you can do some kind of varint coding, then your encoded indices are a bit more than a byte on average. If you plan on zipping later, then make sure the varints are byte-aligned and LSB-first.

There are lots of variants on this, like:

  • keep a small LRU (~32 elements, or whatever transform cache size you’ve optimized for) of indices, and preferentially reference indices based on recent use (e.g. values 1-32), rather than actual value (deltas are offset by 32),
  • make the LRU reference edges rather than verts, so a LRU “hit” gives you two indices instead of one,
  • do two-level high water mark encoding, which makes it efficient to store in multi-indexed form (like .OBJ, which has separate indices per attribute) and decode into normal single-indexed form

And also, these approaches let you be smart about attribute compression as well, since it gives you useful hints; e.g. any edge match lets you do parallelogram prediction, multi-indexing can implicitly tell you how to predict normals from positions.

“High watermark encoding”

I really like this idea. Previously I’d been using simple delta encoding on the resulting index lists; that works, but the problem with delta coding is that a single outlier will produce two large steps – one to go from the current region to the outlier, then another one to get back. The high watermark scheme is almost as straightforward as straight delta coding and avoids this case completely.

Now, if you have an index list straight out of vertex cache optimization and vertex renumbering, the idea works as described. However, with the hybrid tri/paired-tri encoding I described last time, we have to be a bit more careful. While the original index list will indeed have each index be at most 1 larger than the highest index we’ve seen so far, our use of “A ≥ B” to encode whether the next set of indices describes a single triangle or a pair means that we might end up having to start from the second or third vertex of a triangle, and consequently see a larger jump than just 1. Luckily, the fix for this is simple – rather than keeping the high watermark always 1 higher than the largest vertex index we’ve seen so far, we keep it N higher where N is the largest possible “step” we can have in the index list. With that, the transform is really easy, so I’m just going to post my code in full:

static void watermark_transform(std::vector<int>& out_inds,
    const std::vector<int>& in_inds, int max_step)
{
    int hi = max_step - 1; // high watermark
    out_inds.clear();
    out_inds.reserve(in_inds.size());
    for (int v : in_inds)
    {
        assert(v <= hi);
        out_inds.push_back(hi - v);
        hi = std::max(hi, v + max_step);
    }
}

and the inverse is exactly the same, with the push_back in the middle replaced by the two lines

v = hi - v;
out_inds.push_back(v);

So what’s the value of N (aka max_step in the code), the largest step that a new index can be from the highest index we’ve seen so far? Well, for the encoding described last time, it turns out to be 3:

  • When encoding a single triangle, the worst case is a triangle with all-new verts. Suppose the highest index we’ve seen so far is k, and the next triangle has indices (k+1,k+2,k+3). Our encoding for single triangles requires that the first index be larger than the second one, so we would send this triangle as (k+3,k+1,k+2). That’s a step of 3.
  • For a pair of triangles, we get 4 new indices. So it might seem like we might get a worst-case step of 4. However, we know that the two triangles share an edge; and for that to be the case, the shared edge must have been present in the first triangle. Furthermore, we require that the smaller of the two indices be sent first (that’s what flags this as a paired tri). So the worst cases we can have for the first two indices are (k+2,k+3) and (k+1,k+3), both of which have a largest step size of 2. After the first two indices, we only have another two indices to send; worst-case, they are both new, and the third index is larger than the fourth. This corresponds to a step size of 2. All other configurations have step sizes ≤1.

And again, that’s it. Still very simple. So does it help?

Results

Let’s dig out the table again (new entries bold, all percentages relative to the “Vertex cache optimized” row):

Stage Size .zip size .7z size
Original mesh 6082k 3312k 2682k
Vertex cache optimized 6082k 2084k 1504k
Vcache opt, watermark 6082k 1808k (-13.2%) 1388k (-7.7%)
Postprocessed 4939k (-18.8%) 1830k (-12.2%) 1340k (-10.9%)
Postproc, watermark 4939k (-18.8%) 1563k (-25.0%) 1198k (-20.3%)

In short: the two techniques work together perfectly and very nicely complement each other. This is without any varint encoding by the way, still sending raw 32-bit indices. Variable-sized integer encoding would probably help, but I haven’t checked how much. The code on Github has been updated in case you want to play around with it.

Summary

I think this is at a fairly sweet spot in terms of compression ratio vs. decoder complexity. Won originally used this for WebGL, using UTF-8 as his variable-integer encoding: turn the relative indices into Unicode code points, encode the result as UTF-8. This is a bit hacky and limits you to indices that use slightly more than 20 bits (still more than a million, so probably fine for most meshes you’d use in WebGL), but it does mean that the Browser can handle the variable-sized decoding for you (instead of having to deal with byte packing in JS code).

Overall, this approach (postprocess + high watermark) gives a decoder that is maybe 30 lines or so of C++ code, and which does one linear pass over the data (the example program does two passes to keep things clearer, but they can be combined without problems) with no complicated logic whatsoever. It’s simple to get right, easy to drop in, and the results are quite good.

It is not, however, state of the art for mesh compression by any stretch of the imagination. This is a small domain-specific transform that can be applied to fully baked and optimized game assets to make them a bit smaller on disk. I also did not cover vertex data; this is not because vertex data is unimportant, but simply because, so far at least, I’ve not seen any mesh compressors that do something besides the obvious (that is, quantization and parallelogram prediction) for vertex data.

Finally, if what you actually want is state-of-the art triangle mesh compression, you should look elsewhere. This is outside the scope of this post, but good papers to start with are “Triangle Mesh Compression” by Touma and Gotsman (Proceedings of Graphics Interface, Vancouver, June 1998) and “TFAN: A low complexity 3D mesh compression algorithm” by Khaled, Zaharia, and Prêteux (Computer Animation and Virtual Worlds 20.2‐3 (2009)). I’ve played around with the former (the character mesh in Candytron was encoded using an algorithm descended from it) but not the latter; however, Touma-Gotsman and descendants are limited to 2-manifold meshes, whereas TFAN promises better compression and handles arbitrarily topologies, so it looks good on paper at least.

Anyway; that’s it for today. Thanks to Won for his mail! And if you should use this somewhere or figure out a way to get more mileage out of it without making it much more complicated, I’d absolute love to know!


rANS notes

$
0
0

We’ve been spending some time at RAD looking at Jarek Duda’s ANS/ABS coders (paper). This is essentially a new way of doing arithmetic coding with some different trade-offs from the standard methods. In particular, they have a few sweet spots for situations that were (previously) hard to handle efficiently with regular arithmetic coding.

The paper covers numerous algorithms. Of those given, I think what Jarek calls “rANS” and “tANS” are the most interesting ones; there’s plenty of binary arithmetic coders already and “uABS”, “rABS” or “tABS” do not, at first sight, offer any compelling reasons to switch (that said, there’s some non-obvious advantages that I’ll get to in a later post).

Charles has already posted a good introduction; I recommend you start there. Charles has also spent a lot of time dealing with the table-based coders, and the table-based construction allows some extra degrees of freedom that make it hard to see what’s actually going on. In this post, I’m going to mostly talk about rANS, the range coder equivalent. Charles already describes it up to the point where you try to make it “streaming” (i.e. finite precision); I’m going to continue from there.

Streaming rANS

In Charles’ notation (which I’m going to use because the paper uses both indexed upper-case I’s and indexed lower-case l’s, which would make reading this with the default font a disaster), we have two functions now: The coding function C and the decoding function D defined as

C(s,x) := M \lfloor x/F_s \rfloor + B_s + (x \bmod F_s)
D(x) := (s, F_s \lfloor x/M \rfloor + (x \bmod M) - B_s) where s = s(x \bmod M).

D determines the encoded symbol s by looking at (x mod M) and looking up the corresponding value in our cumulative frequency table (s is the unique s such that B_s \le x \bmod M < B_s + F_s).

Okay. If you're working with infinite-precision integers, that's all you need, but that's not exactly suitable for fast (de)compression. We want a way to perform this using finite-precision integers, which means we want to limit the size of x somehow. So what we do is define a "normalized" interval

I := \{ L, L+1, \dots, bL - 1 \} = [L:bL)

The [L:bL) thing on the right is the notation I'll be using for a half-open interval of integers). b is the radix of our encoder; b=2 means we're emitting bits at a time, b=256 means we're emitting bytes, and so forth. Okay. We now want to keep x in this range. Too large x don't fit in finite-precision integers, but why not allow small x? The (hand-wavey) intuition is that too small x don't contain enough information; as Charles mentioned, x essentially contains about \log_2(x) bits of information. If x < 4, it can only be one of four distinct values, and as you saw above the value of x (mod M) directly determines which symbol we're coding. So we want x just right: not too large, not too small. Okay. Now let's look at how a corresponding decoder would look:

  while (!done) {
    // Loop invariant: x is normalized.
    assert(L <= x && x < b*L);

    // Decode a symbol
    s, x = D(x);

    // Renormalization: While x is too small,
    // keep reading more bits (nibbles, bytes, ...)
    while (x < L)
      x = x*b + readFromStream();
  }

Turns out that's actually our decoding algorithm, period. What we need to do now is figure out how the corresponding encoder looks. As long as we're only using C and D with big integers, it's simple; the two are just inverses of each other. Likewise, we want our encoder to be the inverse of our decoder - exactly. That means we have to do the inverse of the operations the decoder does, in the opposite order. Which means our encoder has to look something like this:

  while (!done) {
    // Inverse renormalization: emit bits/bytes etc.
    while (???) {
      writeToStream(x % b);
      x /= b;
    }

    // Encode a symbol
    x = C(s, x);
 
    // Loop invariant: x is normalized
    assert(L <= x && x < b*L);
  }

So far, this is purely mechanical. The only question is what happens in the "???" - when exactly do we emit bits? Well, for the encoder and decoder to be inverses of each other, the answer has to be "exactly when the decoder would read them". Well, the decoder reads bits whenever the normalization variant is violated after decoding a symbol, to make sure it holds for the next iteration of the loop. The encoder, again, needs to do the opposite - we need to proactively emit bits before coding s to make sure that, after we've applied C, x will be normalized.

In fact, that's all we need for a first sketch of renormalization:

  while (!done) {
    // Keep trying until we succeed
    for (;;) {
      x_try = C(s, x);
      if (L <= x_try && x_try < b*L) { // ok?
        x = x_try;
        break;
      } else {
        // Shrink x a bit and try again
        writeToStream(x % b);
        x /= b;
      }
    }

    x = x_try;
  }

Does this work? Well, it might. It depends. We certainly can't guarantee it from where we're standing, though. And even if it does, it's kind of ugly. Can't we do better? What about the normalization - I've just written down the normalization loops, but just because both decoder and encoder maintain the same invariants doesn't necessarily mean they are in sync. What if at some point of the loop, there are more than two possible normalized configurations - can this happen? Plus there's some hidden assumptions in here: the encoder, by only ever shrinking x before C, assumes that C always causes x to increase (or at least never causes x to decrease); similarly, the decoder assumes that applying D won't increase x.

And I'm afraid this is where the proofs begin.

Streaming rANS: the proofs (part 1)

Let's start with the last question first: does C always increase x? It certainly looks like it might, but there's floors involved - what if there's some corner case lurking? Time to check:

C(s,x)
= M \lfloor x/F_s \rfloor + B_s + (x \bmod F_s)
= F_s \lfloor x/F_s \rfloor + (x \bmod F_s) + (M - F_s) \lfloor x/F_s \rfloor + B_s
= x + (M - F_s) \lfloor x/F_s \rfloor + B_s
\ge x

since x/F_s, B_s, and M - F_s are all non-negative (the latter because F_s < M - each symbol's frequency is less than the sum of all symbol frequencies). So C indeed always increases x, or more precisely, never decreases it.

Next up: normalization. Let's tackle the decoder first. First off, is normalization in the decoder unique? That is, if x \in I, is that the only normalized x it could be at that stage in the decoding process? Yes, it is: x \in I = [L:bL), so x \ge L, so

bx + d \ge bx \ge bL where d \in [0:b) arbitrary

That is, no matter what bit / byte / whatever the decoder would read next (that's 'd'), running through the normalization loop once more would cause x to become too large; there's only one way for x to be normalized. But do we always end up with a normalized x? Again, yes. Suppose that x < L, then (because we're working in integers) x \le L - 1, and hence

bx + d \le bL - b + d \le bL - 1 (again d \in [0:b) arbitrary)

The same kind of argument works for the encoder, which floor-divides by b instead of multiplying b it. The key here is that our normalization interval I has a property the ANS paper calls "b-uniqueness": it's of the form I=[k:bk) for some positive integer k (its upper bound is b times its lower bound). Any process that grows (or shrinks) x in multiples of b can't "skip over" I (as in, transition from being larger than the largest value in I to smaller than the smallest value in I or vice versa) in a single step. Simultaneously, there's also never two valid states the encoder/decoder could be in (which could make them go out of sync: both encoder and decoder think they're normalized, but they're at different state values).

To elaborate, suppose we have b=2 and some interval where the ratio between lower and upper bound is a tiny bit less than 2: say I' = [k:2k-1) = \{ k, k+1, \dots, 2k-2 \}. There's just one value missing. Now suppose the decoder is in state x=k-1 and reads a bit, which turns out to be 1. Then the new state is x' = 2x+1 = 2(k-1) + 1 = 2k - 1 \not\in I' - we overshot! We were below the lower bound of I', and yet with a single bit read, we're now past its upper bound. I' is "too small".

Now let's try the other direction; again b=2, and this time we make the ratio between upper and lower bound a bit too high: set I' = [k:2k+1) = \{ k, k+1, \dots, 2k \}. There's no risk of not reaching a state in that interval now, but now there is ambiguity. Where's the problem? Suppose the encoder is in state x=2k. Coding any symbol will require renormalization to "shift out" one bit. The encoder writes that bit (a zero), goes to state x=k, and moves on. But there's a problem: the decoder, after decoding that symbol, will be in state x=k too. And it doesn't know that the encoder got there from state x=2k by shifting a bit; all the decoder knows is that it's in state x=k \in I', which is normalized and doesn't require reading any more bits. So the encoder has written a bit that the decoder doesn't read, and now the two go out of sync.

Long story short: if the state intervals involved aren't b-unique, bad things happen. And on the subject of bad things happening, our encoder tries to find an x such that C(s,x) is inside I by shrinking x - but what if that process doesn't find a suitable x? We need to know a bit more about which values of x lead to C(s,x) being inside I, which leads us to the sets

I_s := \{ x | C(s,x) \in I \}

i.e. the set of all x such that encoding 's' puts us into I again. If all these sets turn out to be b-unique intervals, we're good. If not, we're in trouble. Time for a brief example.

Intermission: why b-uniqueness is necessary

Let's pick L=5, b=2 and M=3. We have just two symbols: 'a' has probability P_a=2/3, and 'b' has probability P_b=1/3, which we turn into F_a = 2, B_a = 0, F_b = 1, B_b = 2. Our normalization interval is I = [5:2\cdot5) = \{5, 6, 7, 8, 9\}. By computing C(s,x) for the relevant values of s and x, we find out that

I_a = \{ 4,5,6 \} = [4:7)
I_b = \{ 1,2 \} = [1:3)

Uh-oh. Neither of these two intervals is b-unique. I_a is too small, and I_b is too big. So what goes wrong?

Well, suppose that we're in state x=7 and want to encode an 'a'. 7 is not in I_a (too large). So the encoder emits the LSB of x, divides by 2 and... now x=3. Well, that's not in I_a either (too small), and shrinking it even further won't help that. So at this point, the encoder is stuck; there's no x it can reach that works.

Proofs (part 2): a sufficient condition for b-uniqueness

So we just saw that in certain scenarios, rANS can just get stuck. Is there anything we can do to avoid it? Yes: the paper points out that the embarrassing situation we just ran into can't happen when M (the sum of all symbol frequencies, the denominator in our probability distribution) divides L, our normalization interval lower bound. That is, L=kM for some positive integer k. It doesn't give details, though; so, knowing this, can we prove anything about the I_s that would help us? Well, let's just look at the elements of I_s and see what we can do:

I_s = \{ x | C(s,x) \in I \}

let's work on that condition:

C(s,x) \in I
\Leftrightarrow L \le C(s,x) < bL
\Leftrightarrow L \le M \lfloor x/F_s \rfloor + B_s + (x \bmod F_s) < bL

at this point, we can use that L=kM and divide by M:

\Leftrightarrow kM \le M \lfloor x/F_s \rfloor + B_s + (x \bmod F_s) < bkM
\Leftrightarrow k \le \lfloor x/F_s \rfloor + (B_s + (x \bmod F_s))/M < bk

Now, for arbitrary real numbers r and natural numbers n we have that

n \le r \Leftrightarrow n \le \lfloor r \rfloor \quad \textrm{and} \quad r < n \Leftrightarrow \lfloor r \rfloor < n

Using this, we get:

\Leftrightarrow k \le \lfloor \lfloor x/F_s \rfloor + (B_s + (x \bmod F_s))/M \rfloor < bk

note the term in the outer floor bracket is the sum of an integer and a real value inside [0,1), since 0 \le B_s + (x \bmod F_s) < M, so we can simplify drastically

\Leftrightarrow k \le \lfloor x/F_s \rfloor < bk
\Leftrightarrow k \le x/F_s < bk
\Leftrightarrow kF_s \le x < bkF_s
\Leftrightarrow x \in [kF_s:bkF_s)

where we applied the floor identities above again and then just multiplied by F_s. Note that the result is an interval of integers with its (exclusive) upper bound being equal to b times its (inclusive) lower bound, just like we need - in other words, assuming that L=kM, all the I_s are b-unique and we're golden (this is mentioned in the paper in section 3.3, but not proven, at least not in the Jan 6 2014 version).

Note that this also gives us a much nicer expression to check for our encoder. In fact, we only need the upper bound (due to b-uniqueness, we know there's no risk of us falling through the lower bound), and we end up with the encoding function

  while (!done) {
    // Loop invariant: x is normalized
    assert(L <= x && x < b*L);

    // Renormalize
    x_max = (b * (L / M)) * freq[s]; // all but freq[s] constant
    while (x >= x_max) {
      writeToStream(x % b);
      x /= b;
    }

    // Encode a symbol
    // x = C(s, x);
    x = freq[s] * (x / M) + (x % M) + base[s];
  }

No "???"s left - we have a "streaming" (finite-precision) version of rANS, which is almost like the arithmetic coders you know and love (and in fact quite closely related) except for the bit where you need to encode your data in reverse (and reverse the resulting byte stream).

I put an actual implementation on Github for the curious.

Some conclusions

This is an arithmetic coder, just a weird one. The reverse encoding seems like a total pain at first, and it kind of is, but it comes with a bunch of really non-obvious but amazing advantages that I'll cover in a later post (or just read the comments in the code). The fact that M (the sum of all frequencies) has to be a multiple of L is a serious limitation, but I don't (yet?) see any way to work around that while preserving b-uniqueness. So the compromise is to pick M and L to be both powers of 2. This makes the decoder's division/mod with M fast. The power-of-2 limitation makes rANS really bad for adaptive coding (where you're constantly updating your stats, and resampling to a power-of-2-sized distribution is expensive), but hey, so is Huffman. As a Huffman replacement, it's really quite good.

In particular, it supports a divide-free decoder (and actually no per-symbol division in the encoder either, if you have a static table; see my code on Github, RansEncPutSymbol in particular). This is something you can't (easily) do with existing multi-symbol arithmetic coders, and is a really cool property to have, because it really puts it a lot closer to being a viable Huffman replacement in a lot of places that do care about the speed.

If you look at the decoder, you'll notice that its entire behavior for a decoding step only depends on the value of x at the beginning: figure out the symbol from the low-order bits of x, go to a new state, read some bits until we're normalized again. This is where the table-based versions (tANS etc.) come into play: you can just tabulate their behavior! To make this work, you want to keep b and L relatively small. Then you just make a table of what happens in every possible state.

Interestingly, because these tables really do tabulate the behavior of a "proper" arithmetic coder, they're compatible: if you have two table-baked distributions with use that same values of b and L (i.e. the same interval I), you can switch between them freely; the states mean the same in both of them. It's not at all obvious that it's even possible for a table-based encoder to have this property, so it's even cooler that it comes with no onerous requirements on the distribution!

That said, as interesting as the table-based schemes are, I think the non-table-based variant (rANS) is actually more widely useful. Having small tables severely limits your probability resolution (and range precision), and big tables are somewhat dubious: adds, integer multiplies and bit operations are fine. We can do these quickly. More compute power is a safe thing to bet on right now (memory access is not). (I do have some data points on what you can do on current HW, but I'll get there in a later post.)

As said, rANS has a bunch of really cool, unusual properties, some of which I'd never have expected to see in any practical entropy coder, with cool consequences. I'll put that in a separate post, though - this one is long (and technical) enough already. Until then!


rANS with static probability distributions

$
0
0

In the previous post, I wrote about rANS in general. The ANS family is, in essence, just a different design approach for arithmetic coders, with somewhat different trade-offs, strengths and weaknesses than existing coders. In this post, I am going to talk specifically about using rANS as a drop-in replacement for (static) Huffman coding: that is, we are encoding data with a known, static probability distribution for symbols. I am also going to assume a compress-once decode-often scenario: slowing down the encoder (within reason) is acceptable if doing so makes the decoder faster. It turns out that rANS is very useful in this kind of setting.

Review

Last time, we defined the rANS encoding and decoding functions, assuming a finite alphabet \mathcal{A} = \{ 0, \dots, n - 1 \} of n symbols numbered 0 to n-1.

C(s,x) := M \lfloor x/F_s \rfloor + B_s + (x \bmod F_s)
D(x) := (s, F_s \lfloor x/M \rfloor + (x \bmod M) - B_s) where s = s(x \bmod M).

where F_s is the frequency of symbol s, B_s = \sum_{i=0}^{s-1} F_i is the sum of the frequencies of all symbols before s, and M = \sum_{i=0}^{n-1} is the sum of all symbol frequencies. Then a given symbol s has (assumed) probability p_s = F_s / M.

Furthermore, as noted in the previous post, M can’t be chosen arbitrarily; it must divide L (the lower bound of our normalized interval) for the encoding/decoding algorithms we saw to work.

Given these constraints and the form of C and D, it’s very convenient to have M be a power of 2; this replaces the divisions and modulo operations in the decoder with bit masking and bit shifts. We also choose L as a power of 2 (which needs to be at least as large as M, since otherwise M can’t divide L).

This means that, starting from a reference probability distribution, we need to approximate the probabilities as fractions with common denominator M. My colleague Charles Bloom just wrote a blog post on that very topic, so I’m going to refer you there for details on how to do this optimally.

Getting rid of per-symbol divisions in the encoder

Making M a power of two removes the division/modulo operations in the decoder, but the encoder still has to perform them. However, note that we’re only ever dividing by the symbol frequencies F_s, which are known at the start of the encoding operation (in our “static probability distribution” setting). The question is, does that help?

You bet it does. A little known fact (amongst most programmers who aren’t compiler writers or bit hacking aficionados anyway) is that division of a p-bit unsigned integer by a constant can always be performed as fixed-point multiplication with a reciprocal, using 2p+1 bits (or less) of intermediate precision. This is exact – no round-off error involved. Compilers like to use this technique on integer divisions by constants, since multiplication (even long multiplication) is typically much faster than division.

There are several papers on how to choose the “magic constants” (with proofs); however, most of them are designed to be used in the code generator of a compiler. As such, they generally have several possible code sequences for division by constants, and try to use the cheapest one that works for the given divisor. This makes sense in a compiler, but not in our case, where the exact frequencies are not known at compile time and doing run-time branching between different possible instruction sequences would cost more than it saves. Therefore, I would suggest sticking with Alverson’s original paper “Integer division using reciprocals”.

The example code I linked to implements this approach, replacing the division/modulo pair with a pair of integer multiplications; when using this approach, it makes sense to limit the state variable to 31 bits (or 63 bits on 64-bit architectures): as said before, the reciprocal method requires 2p+1 bits working precision for worst-case divisors, and reducing the range by 1 bit enables a faster (and simpler) implementation than would be required for a full-range variant (especially in C/C++ code, where multi-precision arithmetic is not easy to express). Note that handling the case F_s=1 requires some extra work; details are explained in the code.

Symbol lookup

There’s one important step in the decoder that I haven’t talked about yet: mapping from the “slot index” x \bmod M to the corresponding symbol index. In normal rANS, each symbol covers a contiguous range of the “slot index” space (by contrast to say tANS, where the slots for any given symbol are spread relatively uniformly across the slot index space). That means that, if all else fails, we can figure out the symbol ID using a binary search in \lceil\log_2 n\rceil steps (remember that n is the size of our alphabet) from the cumulative frequency table (the B_s, which take O(n) space) – independent of the size of M. That’s comforting to know, but doing a binary search per symbol is, in practice, quite expensive compared to the rest of the decoding work we do.

At the other extreme, we can just prepare a look-up table mapping from the cumulative frequency to the corresponding symbol ID. This is very simple (and the technique used in the example code) and theoretically constant-time per symbol, but it requires a table with M entries – and if the table ends up being too large to fit comfortably in a core’s L1 cache, real-world performance (although still technically bounded by a constant per symbol) can get quite bad. Moving in the other direction, if M is small enough, it can make sense to store the per-symbol information in the M-indexed table too, and avoid the extra indirection; I would not recommend this far beyond M=212 though.

Anyway, that gives us two design points: we can use O(n) space, at a cost of O(\log n) per symbol lookup; or we can use O(M) space, with O(1) symbol lookup cost. Now what we’d really like is to get O(1) symbol lookup in O(n) space, but sadly that option’s not on the menu.

Or is it?

The alias method

To make a long story short, I’m not aware of any way to meet our performance goals with the original unmodified rANS algorithm; however, we can do much better if we’re willing to relax our requirements a bit. Notably, there’s no deep reason for us to require that the slots assigned to a given symbol s be contiguous; we already know that e.g. tANS works in a much more relaxed setting. So let’s assume, for the time being, that we can rearrange our slot to symbol mapping arbitrarily (we’ll have to check if this is actually true later, and also work through what it means for our encoder). What does that buy us?

It buys us all we need to meet our performance goals, it turns out (props to my colleague Sean Barrett, who was the first one to figure this out, in our internal email exchanges anyway). As the section title says, the key turns out to be a stochastic sampling technique called the “alias method”. I’m not gonna explain the details here and instead refer you to this short introduction (written by a computational evolutionary geneticist, on randomly picking base pairs) and “Darts, Dice and Coins”, a much longer article that covers multiple ways to sample from a nonuniform distribution (by the way, note that the warnings about numerical instability that often accompany descriptions of the alias method need not worry us; we’re dealing with integer frequencies here so there’s no round-off error).

At this point, you might be wondering what the alias method, a technique for sampling from a non-uniform discrete probability distribution, has anything to do with entropy (de)coding. The answer is that the symbol look-up problem is essentially the same thing: we have a “random” value x \bmod M from the interval [0,M-1], and a matching non-uniform probability distribution (our symbol frequencies). Drawing symbols according to that distribution defines a map from [0,M-1] to our symbol alphabet, which is precisely what we need for our decoding function.

So what does the alias method do? Well, if you followed the link to the article I mentioned earlier, you get the general picture: it partitions the probabilities for our n-symbol alphabet into n “buckets”, such that each bucket i references at most 2 symbols (one of which is symbol i), and the probabilities within each bucket sum to the same value (namely, 1/n). This is always possible, and there is an algorithm (due to Vose) which determines such a partition in O(n) time. More generally, we can do so for any N≥n, by just adding some dummy symbols with frequency 0 at the end. In practice, it’s convenient to have N be a power of two, so for arbitrary n we would just pick N to be the smallest power of 2 that is ≥n.

Translating the sampling terminology to our rANS setting: we can subdivide our interval [0,M-1] into N sub-intervals (“buckets”) of equal size k=M/N, such that each bucket i references at most 2 distinct symbols, one of which is symbol i. We also need to know what the other symbol referenced in this bucket is – alias[i], the “alias” that gives the methods its name – and the position divider[i] of the “dividing line” between the two symbols.

With these two tables, determining the symbol ID from x is quick and easy:

  uint xM = x % M; // bit masking (power-of-2 M)
  uint bucket_id = xM / K; // shift (power-of-2 M/N!)
  uint symbol = bucket_id;
  if (xM >= divider[bucket_id]) // primary symbol or alias?
    symbol = alias[bucket_id];

This is O(1) time and O(N) = O(n) space (for the “divider” and “alias” arrays), as promised. However, this isn’t quite enough for rANS: remember that for our decoding function D, we need to know not just the symbol ID, but also which of the (potentially many) slots assigned to that symbol we ended up in; with regular rANS, this was simple since all slots assigned to a symbol are sequential, starting at slot B_s:
D(x) = (s, F_s \lfloor x/M \rfloor + (x \bmod M) - B_s) where s = s(x \bmod M).
Here, the (x \bmod M) - B_s part is the number we need. Now with the alias method, the slot IDs assigned to a symbol aren’t necessarily contiguous anymore. However, within each bucket, the slot IDs assigned to a symbol are sequential – which means that instead of the cumulative frequencies B_s, we now have two separate per bucket. This allows us to define the complete “alias rANS” decoding function:

  // s, x = D(x) with "alias rANS"
  uint xM = x % M;
  uint bucket_id = xM / K;
  uint symbol, bias;
  if (xM < divider[bucket_id]) { // primary symbol or alias?
    symbol = bucket_id;
    bias = primary_start[bucket_id];
  } else {
    symbol = alias[bucket_id];
    bias = alias_start[bucket_id];
  }
  x = (x / M) * freq[symbol] + xM - bias;

And although this code is written with branches for clarity, it is in fact fairly easy to do branch-free. We gained another two tables indexed with the bucket ID; generating them is another straightforward linear pass over the buckets: we just need to keep track of how many slots we’ve assigned to each symbol so far. And that’s it – this is all we need for a complete “alias rANS” decoder.

However, there’s one more minor tweak we can make: note that the only part of the computation that actually depends on symbol is the evaluation of freq[symbol]; if we store the frequencies for both symbols in each alias table bucket, we can get rid of the dependent look-ups. This can be a performance win in practice; on the other hand, it does waste a bit of extra memory on the alias table, so you might want to skip on it.

Either way, this alias method allow us to perform quite fast (though not as fast as a fully-unrolled table for small M) symbol look-ups, for large M, with memory overhead (and preparation time) proportional to n. That’s quite cool, and might be particularly interesting in cases where you either have relatively small alphabets (say on the order of 15-25 symbols), need lots of different tables, or frequently switch between tables.

Encoding

However, we haven’t covered encoding yet. With regular rANS, encoding is easy, since – again – the slot ranges for each symbol are contiguous; the encoder just does
C(s,x) = M \lfloor x/F_s \rfloor + B_s + (x \bmod F_s)
where B_s + (x \bmod F_s) is the slot id corresponding to the (x \bmod F_s)‘th appearance of symbol s.

With alias rANS, each symbol may have its slots distributed across multiple, disjoint intervals – up to N of them. And the encoder now needs to map (x \bmod F_s) to a corresponding slot index that will decode correctly. One way to do this is to just keep track of the mapping as we build the alias table; this takes O(M) space and is O(1) cost per symbol. Another is to keep a sorted list of subintervals (and their cumulative sizes) assigned to each symbol; this takes only O(N) space, but adds a $O(\log_2 N)$ (worst-case) lookup per symbol in the encoder. Sound familiar?

In short, using the alias method doesn’t really solve the symbol lookup problem for large M; or, more precisely, it solves the lookup problem on the decoder side, but at the cost of adding an equivalent problem on the encoder side. What this means is that we have to pick our poison: faster encoding (at the some extra cost in the decoder), or faster decoding (at some extra cost in the encoder). This is fine, though; it means we get to make a trade-off, depending on which of the two steps is more important to us overall. And as long as we are in a compress-once decompress-often scenario (which is fairly typical), making the decoder faster at some reasonable extra cost in the encoder is definitely useful.

Conclusion

We can exploit static, known probabilities in several ways for rANS and related coders: for encoding, we can precompute the right “magic values” to avoid divisions in the hot encoding loop; and if we want to support large M, the alias method enables fast decoding without generating a giant table with M entries – with an O(n) preprocessing step (where n is the number of symbols), we can still support O(1) symbol decoding, albeit with a (slightly) higher constant factor.

I’m aware that this post is somewhat hand-wavey; the problem is that while Vose’s algorithm and the associated post-processing are actually quite straightforward, there’s a lot of index manipulation, and I find the relevant steps to be quite hard to express in prose without the “explanation” ending up harder to read than the actual code. So instead, my intent was to convey the “big picture”; a sample implementation of alias table rANS, with all the details, can be found – as usual – on Github.

And that’s it for today – take care!


Viewing all 59 articles
Browse latest View live